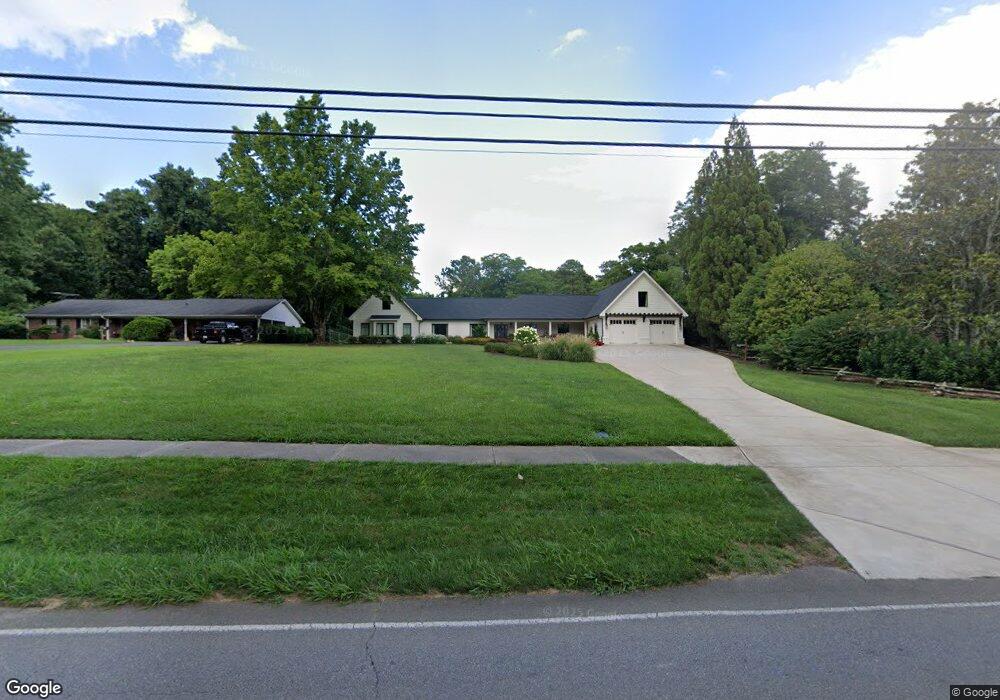
475 S Main St Jasper, GA 30143
Estimated Value: $605,000 - $871,000
1
Bed
2
Baths
3,343
Sq Ft
$211/Sq Ft
Est. Value
About This Home
This home is located at 475 S Main St, Jasper, GA 30143 and is currently estimated at $704,455, approximately $210 per square foot. 475 S Main St is a home located in Pickens County with nearby schools including Harmony Elementary School, Pickens County Middle School, and Pickens County High School.
Ownership History
Date
Name
Owned For
Owner Type
Purchase Details
Closed on
May 29, 2019
Sold by
F C Proctor Properties Llc
Bought by
Demaio Christopher F and Demaio Cindy
Current Estimated Value
Purchase Details
Closed on
Aug 6, 2015
Sold by
Proctor Folsom C
Bought by
Fc Proctor Properties Llc
Purchase Details
Closed on
Dec 5, 2002
Sold by
Proctor Peggy S
Bought by
Proctor Folsom C and Proctor Karen W
Purchase Details
Closed on
Aug 2, 2000
Sold by
Proctor Peggy S
Bought by
Proctor Folsom C and Proctor Karen W
Purchase Details
Closed on
Dec 30, 1999
Sold by
Proctor Peggy S
Bought by
Proctor Folsom C and Proctor Karen W
Purchase Details
Closed on
Aug 30, 1999
Sold by
Worthington Joseph W
Bought by
Proctor Peggy S
Purchase Details
Closed on
Feb 25, 1993
Sold by
Pittman Er Estate
Bought by
Worthington Joseph
Purchase Details
Closed on
Feb 5, 1993
Sold by
Pittman Er Estate
Bought by
Worthington Jospeh
Purchase Details
Closed on
Oct 24, 1980
Bought by
Pittman Pittman E and Pittman R
Create a Home Valuation Report for This Property
The Home Valuation Report is an in-depth analysis detailing your home's value as well as a comparison with similar homes in the area
Home Values in the Area
Average Home Value in this Area
Purchase History
| Date | Buyer | Sale Price | Title Company |
|---|---|---|---|
| Demaio Christopher F | $235,000 | -- | |
| Fc Proctor Properties Llc | -- | -- | |
| F C Proctor Properties Llc | -- | -- | |
| Proctor Folsom C | -- | -- | |
| Proctor Peggy S | -- | -- | |
| Proctor Folsom C | -- | -- | |
| Proctor Folsom C | -- | -- | |
| Proctor Peggy S | $161,000 | -- | |
| Worthington Joseph | -- | -- | |
| Worthington Jospeh | $130,900 | -- | |
| Pittman Pittman E | $87,500 | -- |
Source: Public Records
Tax History
| Year | Tax Paid | Tax Assessment Tax Assessment Total Assessment is a certain percentage of the fair market value that is determined by local assessors to be the total taxable value of land and additions on the property. | Land | Improvement |
|---|---|---|---|---|
| 2025 | $7,558 | $308,797 | $15,216 | $293,581 |
| 2024 | $7,741 | $308,797 | $15,216 | $293,581 |
| 2023 | $7,908 | $308,797 | $15,216 | $293,581 |
| 2022 | $4,422 | $217,402 | $15,216 | $202,186 |
| 2021 | $4,737 | $217,402 | $15,216 | $202,186 |
| 2020 | $2,610 | $116,309 | $15,216 | $101,093 |
| 2019 | $1,698 | $73,957 | $26,860 | $47,097 |
| 2018 | $1,714 | $73,957 | $26,860 | $47,097 |
| 2017 | $1,742 | $73,957 | $26,860 | $47,097 |
| 2016 | $1,770 | $73,957 | $26,860 | $47,097 |
| 2015 | $1,664 | $71,201 | $24,104 | $47,097 |
| 2014 | $1,668 | $71,201 | $24,104 | $47,097 |
| 2013 | -- | $71,201 | $24,104 | $47,097 |
Source: Public Records
Map
Nearby Homes
- 8266 Cox Mountain Dr
- 597 S Main St
- 365 Summit View Ln
- 288 Blazingstar Trail
- 0 Black Hawk Place Lot 242 Unit 7715035
- 0 Black Hawk Place Lot 242 Unit 10686039
- 365 Summit View Ln Unit 6
- TBD Cowart Mountain Tract 3 Rd
- 87 Jones St
- 80 Jones St
- 190 Towne Villas Dr
- 28 Sandstone Dr
- 24 N Rim Dr
- 5566 Red Fox Ln
- 0 Hunters Ridge Rd Unit 7714906
- 2668 Highland Trail
- 5574 Red Fox Ln
- 321 Owls Brow
- 80 Mountain Mint Dr
- 0 Hunters Ridge Rd Unit 10685847