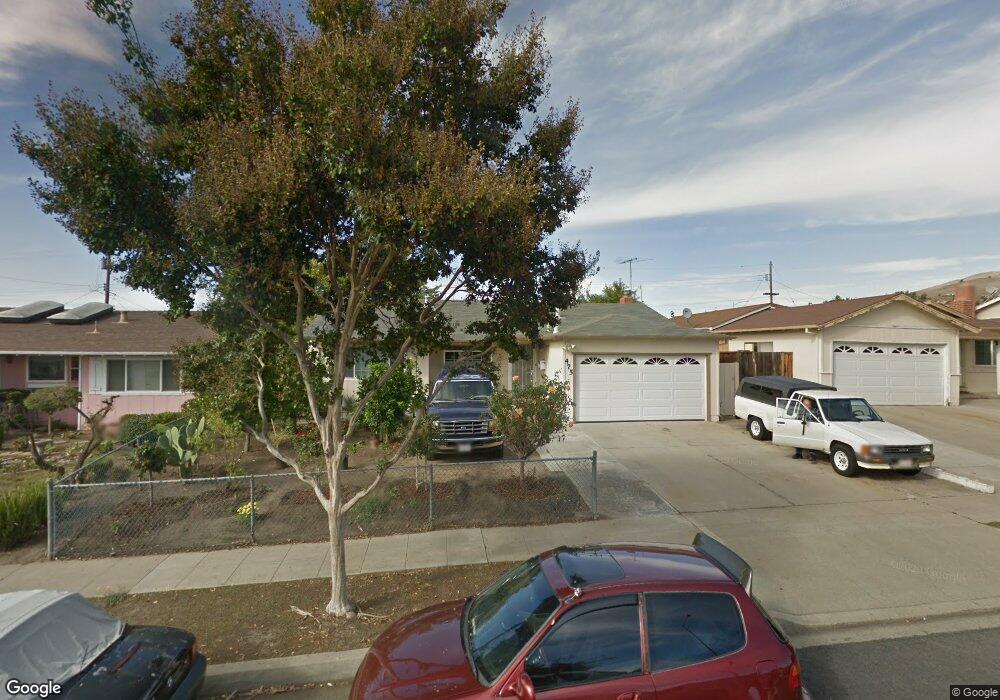
475 Taylor Dr Milpitas, CA 95035
Estimated Value: $1,336,000 - $1,609,617
4
Beds
2
Baths
1,673
Sq Ft
$870/Sq Ft
Est. Value
About This Home
This home is located at 475 Taylor Dr, Milpitas, CA 95035 and is currently estimated at $1,455,904, approximately $870 per square foot. 475 Taylor Dr is a home located in Santa Clara County with nearby schools including Joseph Weller Elementary School, Thomas Russell Middle School, and Milpitas High School.
Ownership History
Date
Name
Owned For
Owner Type
Purchase Details
Closed on
Dec 20, 2017
Sold by
Bui Wenny Hoang and Bui Wilson
Bought by
Bui Wilson
Current Estimated Value
Home Financials for this Owner
Home Financials are based on the most recent Mortgage that was taken out on this home.
Original Mortgage
$521,000
Outstanding Balance
$438,409
Interest Rate
3.92%
Mortgage Type
New Conventional
Estimated Equity
$1,017,495
Purchase Details
Closed on
Jan 19, 2016
Sold by
Bui Wenny Hoang
Bought by
Bui Wenny Hoang and Bui Wilson
Purchase Details
Closed on
Jun 13, 2000
Sold by
Olsen Theodore M and Olsen Judith M
Bought by
Bui Wenny Hoang
Home Financials for this Owner
Home Financials are based on the most recent Mortgage that was taken out on this home.
Original Mortgage
$321,600
Interest Rate
8.53%
Create a Home Valuation Report for This Property
The Home Valuation Report is an in-depth analysis detailing your home's value as well as a comparison with similar homes in the area
Home Values in the Area
Average Home Value in this Area
Purchase History
| Date | Buyer | Sale Price | Title Company |
|---|---|---|---|
| Bui Wilson | $131,000 | None Available | |
| Bui Wenny Hoang | -- | None Available | |
| Bui Wenny Hoang | $402,000 | First American Title Guarant |
Source: Public Records
Mortgage History
| Date | Status | Borrower | Loan Amount |
|---|---|---|---|
| Open | Bui Wilson | $521,000 | |
| Closed | Bui Wenny Hoang | $321,600 |
Source: Public Records
Tax History
| Year | Tax Paid | Tax Assessment Tax Assessment Total Assessment is a certain percentage of the fair market value that is determined by local assessors to be the total taxable value of land and additions on the property. | Land | Improvement |
|---|---|---|---|---|
| 2025 | $7,188 | $617,455 | $277,719 | $339,736 |
| 2024 | $7,188 | $605,349 | $272,274 | $333,075 |
| 2023 | $7,166 | $593,481 | $266,936 | $326,545 |
| 2022 | $7,138 | $581,845 | $261,702 | $320,143 |
| 2021 | $7,035 | $570,437 | $256,571 | $313,866 |
| 2020 | $6,913 | $564,589 | $253,941 | $310,648 |
| 2019 | $6,836 | $553,519 | $248,962 | $304,557 |
| 2018 | $6,495 | $542,667 | $244,081 | $298,586 |
| 2017 | $6,412 | $532,028 | $239,296 | $292,732 |
| 2016 | $6,074 | $521,597 | $234,604 | $286,993 |
| 2015 | $6,012 | $513,764 | $231,081 | $282,683 |
| 2014 | $5,845 | $503,701 | $226,555 | $277,146 |
Source: Public Records
Map
Nearby Homes
- 1637 Roger St
- 390 Valmy St
- 479 Dixon Rd
- 372 Gosser St
- 716 Sussex Place
- 1308 N Hillview Dr
- 2000 Scott Creek Rd
- 120 Dixon Landing Rd Unit 147
- 120 Dixon Landing Rd Unit 9
- 48875 Chenin Blanc Dr
- 60 Wilson Way Unit 104
- 60 Wilson Way Unit 150
- 60 Wilson Way Unit 55
- 1000 Jacklin Rd
- 1103 Creed St
- 272 Fountain Grass Terrace
- 60 Jacklin Place
- 48962 Woodgrove Common Unit 143
- 465 Wilaneta Ave
- 685 Parvin Dr
- 483 Taylor Dr
- 469 Taylor Dr
- 464 Woodcock Ct
- 461 Taylor Dr
- 489 Taylor Dr
- 576 Greathouse Dr
- 472 Woodcock Ct
- 456 Woodcock Ct
- 472 Taylor Dr
- 480 Taylor Dr
- 570 Greathouse Dr
- 466 Taylor Dr
- 453 Taylor Dr
- 486 Taylor Dr
- 458 Taylor Dr
- 448 Woodcock Ct
- 564 Greathouse Dr
- 475 Woodcock Ct
- 445 Taylor Dr
- 492 Taylor Dr
Your Personal Tour Guide
Ask me questions while you tour the home.