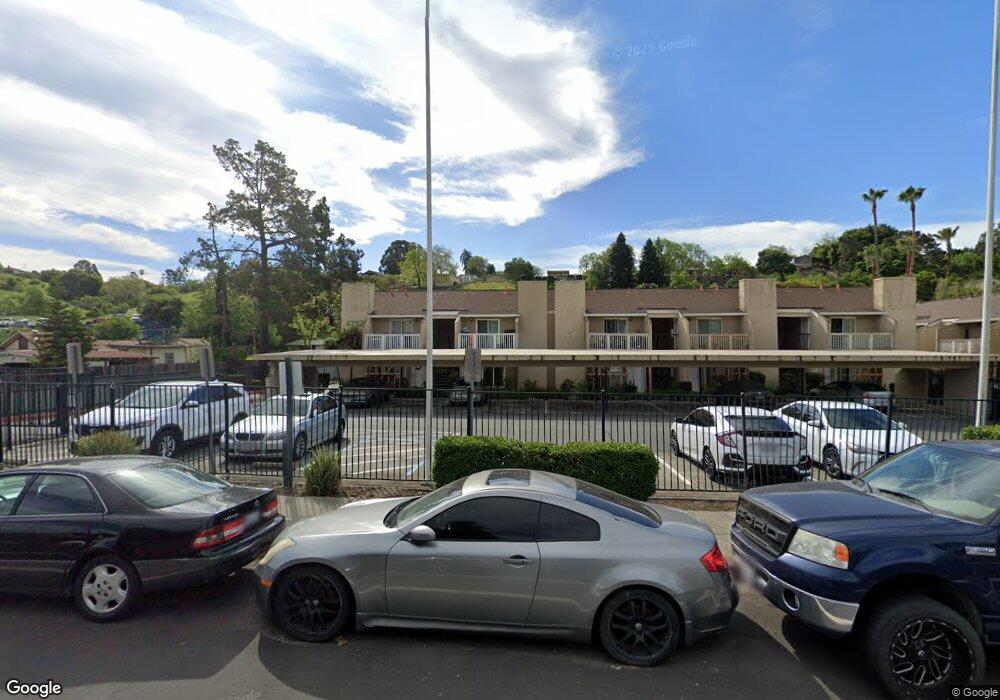
4750 Appian Way Unit 65 El Sobrante, CA 94803
Hilltop Green NeighborhoodEstimated Value: $279,000 - $399,000
2
Beds
2
Baths
943
Sq Ft
$359/Sq Ft
Est. Value
About This Home
This home is located at 4750 Appian Way Unit 65, El Sobrante, CA 94803 and is currently estimated at $338,928, approximately $359 per square foot. 4750 Appian Way Unit 65 is a home located in Contra Costa County with nearby schools including Murphy Elementary School, Betty Reid Soskin Middle School, and De Anza Senior High School.
Ownership History
Date
Name
Owned For
Owner Type
Purchase Details
Closed on
Dec 19, 2017
Sold by
Sanwal Surinder and Sanwal Deborah Jean
Bought by
Sanwal Surinder K and Sanwal Deborah J
Current Estimated Value
Purchase Details
Closed on
Aug 23, 2010
Sold by
Bank Of America Na
Bought by
Sanwal Surinder and Sanwal Deborah Jean
Purchase Details
Closed on
Jun 2, 2010
Sold by
Villalobos Juan Antonio and Villalobos Hercila
Bought by
Bank Of America Na
Purchase Details
Closed on
May 18, 2007
Sold by
4740 Appian Way Llc
Bought by
Villalobos Juan Antonio and Villalobos Hercila
Purchase Details
Closed on
Oct 13, 2005
Sold by
Mediterranea Apartments Llc
Bought by
4740 Appian Way Llc
Home Financials for this Owner
Home Financials are based on the most recent Mortgage that was taken out on this home.
Original Mortgage
$11,500,000
Interest Rate
5.67%
Mortgage Type
Construction
Purchase Details
Closed on
May 20, 2004
Sold by
Dowd Edward M
Bought by
Mediterranea Apartments Llc
Create a Home Valuation Report for This Property
The Home Valuation Report is an in-depth analysis detailing your home's value as well as a comparison with similar homes in the area
Home Values in the Area
Average Home Value in this Area
Purchase History
| Date | Buyer | Sale Price | Title Company |
|---|---|---|---|
| Sanwal Surinder K | -- | None Available | |
| Sanwal Surinder | $95,000 | Landsafe Title | |
| Bank Of America Na | $93,600 | Landsafe Title | |
| Villalobos Juan Antonio | $369,000 | Financial Title Company | |
| 4740 Appian Way Llc | $9,800,000 | Financial Title | |
| Mediterranea Apartments Llc | -- | -- |
Source: Public Records
Mortgage History
| Date | Status | Borrower | Loan Amount |
|---|---|---|---|
| Previous Owner | 4740 Appian Way Llc | $11,500,000 |
Source: Public Records
Tax History Compared to Growth
Tax History
| Year | Tax Paid | Tax Assessment Tax Assessment Total Assessment is a certain percentage of the fair market value that is determined by local assessors to be the total taxable value of land and additions on the property. | Land | Improvement |
|---|---|---|---|---|
| 2025 | $2,575 | $121,700 | $12,806 | $108,894 |
| 2024 | $2,510 | $119,314 | $12,555 | $106,759 |
| 2023 | $2,510 | $116,975 | $12,309 | $104,666 |
| 2022 | $2,460 | $114,682 | $12,068 | $102,614 |
| 2021 | $2,430 | $112,434 | $11,832 | $100,602 |
| 2019 | $2,392 | $109,101 | $11,482 | $97,619 |
| 2018 | $2,281 | $106,962 | $11,257 | $95,705 |
| 2017 | $2,200 | $104,866 | $11,037 | $93,829 |
| 2016 | $2,134 | $102,811 | $10,821 | $91,990 |
| 2015 | $2,094 | $101,268 | $10,659 | $90,609 |
| 2014 | $2,083 | $99,286 | $10,451 | $88,835 |
Source: Public Records
Map
Nearby Homes
- 4623 Appian Way
- 435 Colina Way
- 476 Colina Way
- 4556 Appian Way Unit 36
- 4556 Appian Way Unit 12
- 4428 Santa Rita Rd
- 636 Pebble Dr
- 3115 Deseret Dr
- 663 Renfrew Rd
- 742 La Paloma Rd
- 4778 Hilltop Dr Unit 1
- 2835 Stephen Dr
- 4503 Gregory Way
- 535 Rincon Rd
- 61 Homer Ct
- 5026 Hilltop Dr
- 371 Joan Vista St
- 3179 Keith Dr
- 4370 Wesley Way
- 1923 Thompson Ln
- 4750 Appian Way Unit 64
- 4750 Appian Way Unit 63
- 4750 Appian Way Unit 62
- 4750 Appian Way Unit 61
- 4750 Appian Way Unit 60
- 4740 Appian Way Unit 1
- 4740 Appian Way
- 4740 Appian Way Unit 11
- 4740 Appian Way
- 4740 Appian Way
- 4740 Appian Way Unit 22
- 4740 Appian Way Unit 21
- 4740 Appian Way Unit 20
- 4740 Appian Way Unit 10
- 4740 Appian Way Unit 9
- 4740 Appian Way Unit 8
- 4740 Appian Way Unit 7
- 4740 Appian Way Unit 6
- 4740 Appian Way Unit 5
- 4740 Appian Way Unit 4