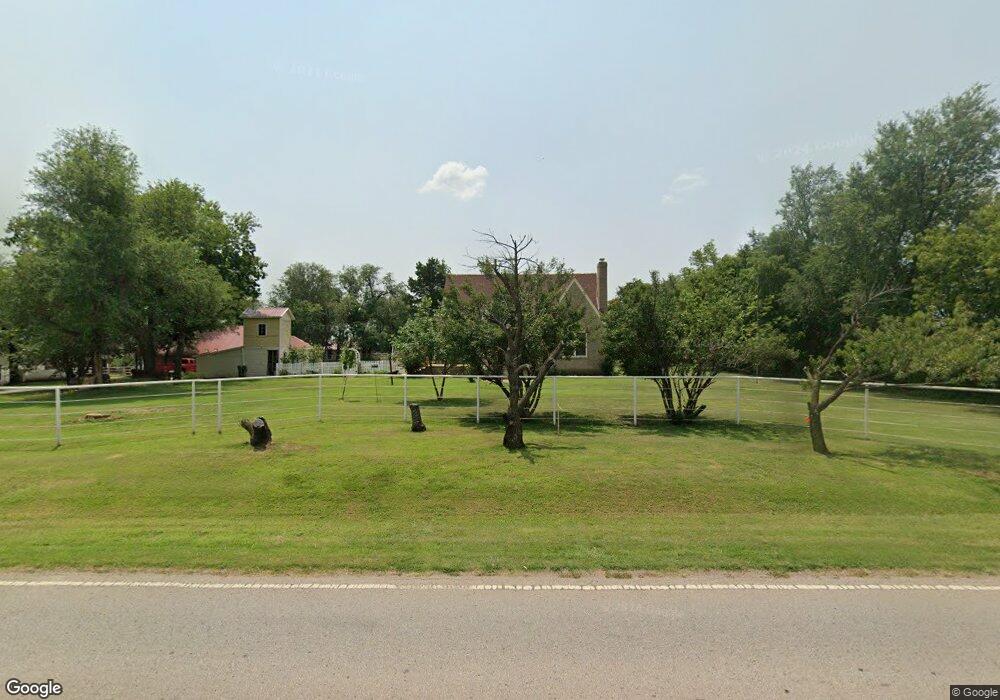
4750 W Waterloo Rd Edmond, OK 73025
West Edmond NeighborhoodEstimated Value: $413,000 - $574,000
4
Beds
1
Bath
2,900
Sq Ft
$175/Sq Ft
Est. Value
About This Home
This home is located at 4750 W Waterloo Rd, Edmond, OK 73025 and is currently estimated at $506,878, approximately $174 per square foot. 4750 W Waterloo Rd is a home located in Oklahoma County with nearby schools including Prairie Vale Elementary School, Deer Creek Middle School, and Deer Creek Intermediate School.
Ownership History
Date
Name
Owned For
Owner Type
Purchase Details
Closed on
Apr 4, 2022
Sold by
Gilkey Herbert L and Gilkey Tamara D
Bought by
Ht Gilkey Trust
Current Estimated Value
Purchase Details
Closed on
Mar 30, 2022
Sold by
Gilkey Herbert L and Gilkey Tamara D
Bought by
Ht Gilkey Trust
Purchase Details
Closed on
May 10, 2006
Sold by
Butler Keena Ann and Butler Scott Carlton
Bought by
Gilkey Herbert L and Gilkey Tamara D
Home Financials for this Owner
Home Financials are based on the most recent Mortgage that was taken out on this home.
Original Mortgage
$163,000
Interest Rate
6.5%
Mortgage Type
Fannie Mae Freddie Mac
Purchase Details
Closed on
May 25, 2005
Sold by
Maberry Arja U and Maberry James R
Bought by
Oden Keena A
Purchase Details
Closed on
Oct 29, 1997
Sold by
Evans Leslie N and Evans Kimala D
Bought by
Maberry Arja U and Maberry James R
Create a Home Valuation Report for This Property
The Home Valuation Report is an in-depth analysis detailing your home's value as well as a comparison with similar homes in the area
Home Values in the Area
Average Home Value in this Area
Purchase History
| Date | Buyer | Sale Price | Title Company |
|---|---|---|---|
| Ht Gilkey Trust | -- | Wallis Law Group | |
| Ht Gilkey Trust | -- | Wallis Law Group | |
| Gilkey Herbert L | $279,000 | Oklahoma City Abstract & Tit | |
| Oden Keena A | $244,000 | Stewart Abstract & Title Of | |
| Maberry Arja U | $213,000 | -- |
Source: Public Records
Mortgage History
| Date | Status | Borrower | Loan Amount |
|---|---|---|---|
| Previous Owner | Gilkey Herbert L | $163,000 |
Source: Public Records
Tax History Compared to Growth
Tax History
| Year | Tax Paid | Tax Assessment Tax Assessment Total Assessment is a certain percentage of the fair market value that is determined by local assessors to be the total taxable value of land and additions on the property. | Land | Improvement |
|---|---|---|---|---|
| 2024 | $4,230 | $35,038 | $10,316 | $24,722 |
| 2023 | $4,230 | $35,038 | $10,747 | $24,291 |
| 2022 | $3,908 | $35,037 | $14,077 | $20,960 |
| 2021 | $3,728 | $34,016 | $14,731 | $19,285 |
| 2020 | $3,996 | $33,026 | $14,668 | $18,358 |
| 2019 | $234 | $32,065 | $16,244 | $15,821 |
| 2018 | $235 | $32,230 | $0 | $0 |
| 2017 | $230 | $31,503 | $15,612 | $15,891 |
| 2016 | $3,723 | $30,585 | $10,100 | $20,485 |
| 2015 | $3,310 | $29,694 | $10,495 | $19,199 |
| 2014 | $3,244 | $28,830 | $10,552 | $18,278 |
Source: Public Records
Map
Nearby Homes
- 0 W Waterloo Rd
- 14550 S Pennsylvania Ave
- 4150 W Waterloo Rd
- 1720 Silver Oaks Dr
- 1851 Silver Oaks Dr
- 5809 W Waterloo Rd
- 10140 Oakwood Dr
- 14500 Meadow Ridge Ln
- 10260 Oakwood Dr
- 13460 Blue Star St
- 13420 Saltgrass Dr
- 13400 Ridge Cir
- 13791 Scenic View Ln
- 13310 S Pennsylvania Ave
- 4648 Kensington Way
- 13172 Mannington Rd
- 13156 Mannington Rd
- 13157 Huntington Dr
- 13525 Creek View Dr
- 9765 Livingston Rd
- 4751 W Waterloo Rd
- 0 NW 248th St & Pennsylvania Ave Unit 1072682
- 4401 W Waterloo Rd
- 14614 Fox Lair Ln
- 4374 W Waterloo Rd
- 10021 Fox Lair Ln
- 14550 S Pennsylvania Ave
- 1521 Silver Oaks Dr
- 10061 Red Fox Dr
- 10060 Red Fox Dr
- 24521 N Pennsylvania Ave
- 14500 S Pennsylvania Ave
- 1501 Silver Oaks Dr
- 4790 Penn Place Dr
- 4772 Penn Place Dr Unit ONE
- 4808 Penn Place Dr
- 4826 Penn Place Dr
- 1421 Silver Oaks Dr
- 1621 Silver Oaks Dr
- 4914 Penn Place Dr