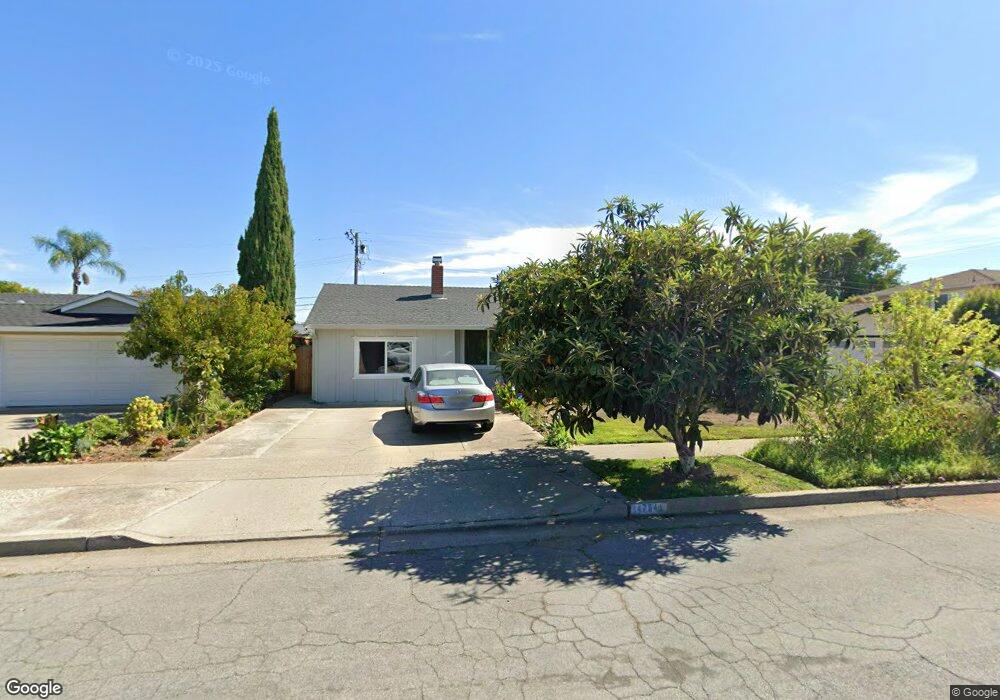
4754 Bannock Cir San Jose, CA 95130
Westmont NeighborhoodEstimated Value: $917,000 - $2,208,000
3
Beds
2
Baths
1,087
Sq Ft
$1,592/Sq Ft
Est. Value
About This Home
This home is located at 4754 Bannock Cir, San Jose, CA 95130 and is currently estimated at $1,729,975, approximately $1,591 per square foot. 4754 Bannock Cir is a home located in Santa Clara County with nearby schools including Westmont High School, Forest Hill Elementary School, and Rolling Hills Middle.
Ownership History
Date
Name
Owned For
Owner Type
Purchase Details
Closed on
Jul 9, 2020
Sold by
Aniran Maliheh and Nikkhah Ali Reza
Bought by
Aniran Maliheh and Nikkhah Ali Reza
Current Estimated Value
Home Financials for this Owner
Home Financials are based on the most recent Mortgage that was taken out on this home.
Original Mortgage
$479,000
Outstanding Balance
$424,745
Interest Rate
3.1%
Mortgage Type
New Conventional
Estimated Equity
$1,305,230
Purchase Details
Closed on
Aug 16, 2017
Sold by
Nikkhah Alireza and Aniran Maliheh
Bought by
Nikkhah Alireza and Aniran Maliheh
Purchase Details
Closed on
Nov 16, 2012
Sold by
Nikkhah Leilee
Bought by
Nikkhah Alireza and Aniran Maliheh
Home Financials for this Owner
Home Financials are based on the most recent Mortgage that was taken out on this home.
Original Mortgage
$472,500
Interest Rate
3.36%
Mortgage Type
New Conventional
Purchase Details
Closed on
May 20, 2011
Sold by
Aniran Maliheh and Nikkhah Alireza
Bought by
Nikkhah Alireza and Aniran Maliheh
Home Financials for this Owner
Home Financials are based on the most recent Mortgage that was taken out on this home.
Original Mortgage
$473,550
Interest Rate
4.73%
Mortgage Type
New Conventional
Purchase Details
Closed on
Mar 24, 2005
Sold by
Aniran Maliheh and Nikkhah Alireza
Bought by
Nikkhah Alireza and Aniran Maliheh
Home Financials for this Owner
Home Financials are based on the most recent Mortgage that was taken out on this home.
Original Mortgage
$520,000
Interest Rate
5.6%
Mortgage Type
Purchase Money Mortgage
Purchase Details
Closed on
Mar 29, 2004
Sold by
Wang Tony Chiyao and Chang Ya Fei
Bought by
Nikkhah Alireza and Amran Maliheh
Home Financials for this Owner
Home Financials are based on the most recent Mortgage that was taken out on this home.
Original Mortgage
$440,000
Interest Rate
6.65%
Mortgage Type
Purchase Money Mortgage
Purchase Details
Closed on
Jun 2, 2000
Sold by
Olsen Brenda Marie
Bought by
Wang Tony Chiyao and Chang Ya Fei
Home Financials for this Owner
Home Financials are based on the most recent Mortgage that was taken out on this home.
Original Mortgage
$344,000
Interest Rate
7.95%
Purchase Details
Closed on
Dec 21, 1993
Sold by
Nilsson Brenda M and Rathman Karen M
Bought by
Nilsson Brenda M
Home Financials for this Owner
Home Financials are based on the most recent Mortgage that was taken out on this home.
Original Mortgage
$95,000
Interest Rate
7%
Create a Home Valuation Report for This Property
The Home Valuation Report is an in-depth analysis detailing your home's value as well as a comparison with similar homes in the area
Home Values in the Area
Average Home Value in this Area
Purchase History
| Date | Buyer | Sale Price | Title Company |
|---|---|---|---|
| Aniran Maliheh | -- | Chicago Title Company | |
| Nikkhah Ali Reza | $160,000 | Chicago Title Company | |
| Nikkhah Alireza | -- | None Available | |
| Nikkhah Alireza | $119,000 | North American Title Company | |
| Nikkhah Alireza | $283,000 | North American Title Company | |
| Nikkhah Alireza | $305,000 | Fidelity National Title Ins | |
| Nikkhah Alireza | $550,000 | North American Title Company | |
| Wang Tony Chiyao | $430,000 | Financial Title Company | |
| Nilsson Brenda M | -- | First American Title Guarant |
Source: Public Records
Mortgage History
| Date | Status | Borrower | Loan Amount |
|---|---|---|---|
| Open | Nikkhah Ali Reza | $479,000 | |
| Previous Owner | Nikkhah Alireza | $472,500 | |
| Previous Owner | Nikkhah Alireza | $473,550 | |
| Previous Owner | Nikkhah Alireza | $520,000 | |
| Previous Owner | Nikkhah Alireza | $440,000 | |
| Previous Owner | Wang Tony Chiyao | $344,000 | |
| Previous Owner | Nilsson Brenda M | $95,000 | |
| Closed | Nikkhah Alireza | $110,000 | |
| Closed | Nikkhah Alireza | $90,000 |
Source: Public Records
Tax History Compared to Growth
Tax History
| Year | Tax Paid | Tax Assessment Tax Assessment Total Assessment is a certain percentage of the fair market value that is determined by local assessors to be the total taxable value of land and additions on the property. | Land | Improvement |
|---|---|---|---|---|
| 2025 | $10,748 | $786,061 | $368,727 | $417,334 |
| 2024 | $10,748 | $770,649 | $361,498 | $409,151 |
| 2023 | $10,539 | $755,539 | $354,410 | $401,129 |
| 2022 | $10,468 | $740,725 | $347,461 | $393,264 |
| 2021 | $10,255 | $726,202 | $340,649 | $385,553 |
| 2020 | $10,065 | $718,757 | $337,157 | $381,600 |
| 2019 | $9,934 | $704,665 | $330,547 | $374,118 |
| 2018 | $9,662 | $690,849 | $324,066 | $366,783 |
| 2017 | $9,455 | $677,304 | $317,712 | $359,592 |
| 2016 | $8,928 | $664,025 | $311,483 | $352,542 |
| 2015 | $8,805 | $654,052 | $306,805 | $347,247 |
| 2014 | $8,168 | $641,241 | $300,796 | $340,445 |
Source: Public Records
Map
Nearby Homes
- 2476 Le Bain Dr
- 4736 Westmont Ave
- 2303 Camrose Ave
- 12890 Lantana Ave
- 4599 Tilbury Dr
- 4994 Peach Terrace
- 2267 Fenian Dr
- 5169 Bobbie Ave
- 1815 Bucknall Rd
- 1803 Bucknall Rd
- 4065 Keith Dr
- 935 S San Tomas Aquino Rd
- 2090 Elmgrove Ln
- 1901 La Corona Ct
- 146 English Rose Cir
- 18677 Mccoy Ave
- 2025 Woodglen Dr
- 1797 W Campbell Ave
- 18732 Afton Ave
- 107 Naramore Ln
- 4762 Bannock Cir
- 4750 Bannock Cir
- 2619 Meta Dr
- 2615 Meta Dr
- 2623 Meta Dr
- 4744 Bannock Cir
- 4766 Bannock Cir
- 2611 Meta Dr
- 2627 Meta Dr
- 4785 Bannock Cir
- 4749 Bannock Cir
- 4738 Bannock Cir
- 4772 Bannock Cir
- 4747 Bannock Cir
- 2607 Meta Dr
- 2631 Meta Dr
- 4797 Bannock Cir
- 4743 Bannock Cir
- 4778 Bannock Cir
- 2620 Meta Dr