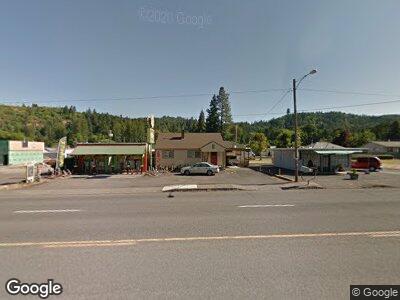
47573 Highway 58 Oakridge, OR 97463
Oakridge NeighborhoodEstimated Value: $466,115
3
Beds
3
Baths
3,588
Sq Ft
$130/Sq Ft
Est. Value
About This Home
This home is located at 47573 Highway 58, Oakridge, OR 97463 and is currently estimated at $466,115, approximately $129 per square foot. 47573 Highway 58 is a home located in Lane County with nearby schools including Oakridge Elementary School, Oakridge Junior High School, and Oakridge High School.
Ownership History
Date
Name
Owned For
Owner Type
Purchase Details
Closed on
Aug 14, 2015
Sold by
Valencia Josefina
Bought by
Larue James B and Wooster Allan
Current Estimated Value
Purchase Details
Closed on
Jul 6, 2009
Sold by
King Travis S and King Rachel L
Bought by
Frelich Peter R and Frelich Sandra M
Purchase Details
Closed on
Aug 28, 2005
Sold by
Fogg Susan
Bought by
King Travis S and King Rachel L
Home Financials for this Owner
Home Financials are based on the most recent Mortgage that was taken out on this home.
Original Mortgage
$95,000
Interest Rate
5.64%
Mortgage Type
Unknown
Purchase Details
Closed on
Jan 24, 2002
Sold by
Holly Linda Tharp and Scholl Mary Ann
Bought by
Fogg Susan
Home Financials for this Owner
Home Financials are based on the most recent Mortgage that was taken out on this home.
Original Mortgage
$75,000
Interest Rate
7.04%
Mortgage Type
Commercial
Purchase Details
Closed on
Feb 6, 1996
Sold by
Paddock Ronel M and Paddock Mary Lynette
Bought by
Tharp Linda and Scholl Mary Ann
Create a Home Valuation Report for This Property
The Home Valuation Report is an in-depth analysis detailing your home's value as well as a comparison with similar homes in the area
Home Values in the Area
Average Home Value in this Area
Purchase History
| Date | Buyer | Sale Price | Title Company |
|---|---|---|---|
| Larue James B | $11,500 | Evergreen Land Title Company | |
| Frelich Peter R | $220,000 | Western Title | |
| King Travis S | $195,500 | Fidelity National Title Insu | |
| Fogg Susan | $149,900 | Western Pioneer Title Co | |
| Tharp Linda | $118,000 | Cascade Title Co |
Source: Public Records
Mortgage History
| Date | Status | Borrower | Loan Amount |
|---|---|---|---|
| Previous Owner | King Travis S | $138,000 | |
| Previous Owner | King Travis S | $95,000 | |
| Previous Owner | Fogg Susan | $75,000 | |
| Closed | Fogg Susan | $42,000 |
Source: Public Records
Tax History Compared to Growth
Tax History
| Year | Tax Paid | Tax Assessment Tax Assessment Total Assessment is a certain percentage of the fair market value that is determined by local assessors to be the total taxable value of land and additions on the property. | Land | Improvement |
|---|---|---|---|---|
| 2023 | $3,968 | $233,442 | $0 | $0 |
| 2022 | $3,693 | $226,643 | $0 | $0 |
| 2021 | $3,439 | $220,042 | $0 | $0 |
| 2020 | $3,390 | $217,151 | $0 | $0 |
| 2019 | $3,297 | $210,827 | $0 | $0 |
| 2018 | $3,146 | $198,725 | $0 | $0 |
| 2017 | $3,063 | $198,725 | $0 | $0 |
| 2016 | $3,087 | $192,937 | $0 | $0 |
| 2015 | $3,017 | $187,317 | $0 | $0 |
| 2014 | $3,024 | $181,861 | $0 | $0 |
Source: Public Records
Map
Nearby Homes
- 47621 Paddock Ln
- 47638 Highway 58
- 47541 Hansen St
- 76550 Fir St
- 47554 Hansen St
- 47706 Highway 58
- 47692 W 1st St
- 76582 Davis Rd
- 47520 Perkins St
- 47576 Riverview St
- 47393 Oregon 58
- 76348 Christel Ln
- 47712 Portal Dr
- 0 Christel Ln Unit 16675180
- 0 Christel Ln Unit 16539284
- 0 Christel Ln Unit 16441517
- 0 Christel Ln Unit 16367961
- 0 Christel Ln Unit 16224102
- 0 Christel Ln Unit 16081525
- 47753 Chubb Ct