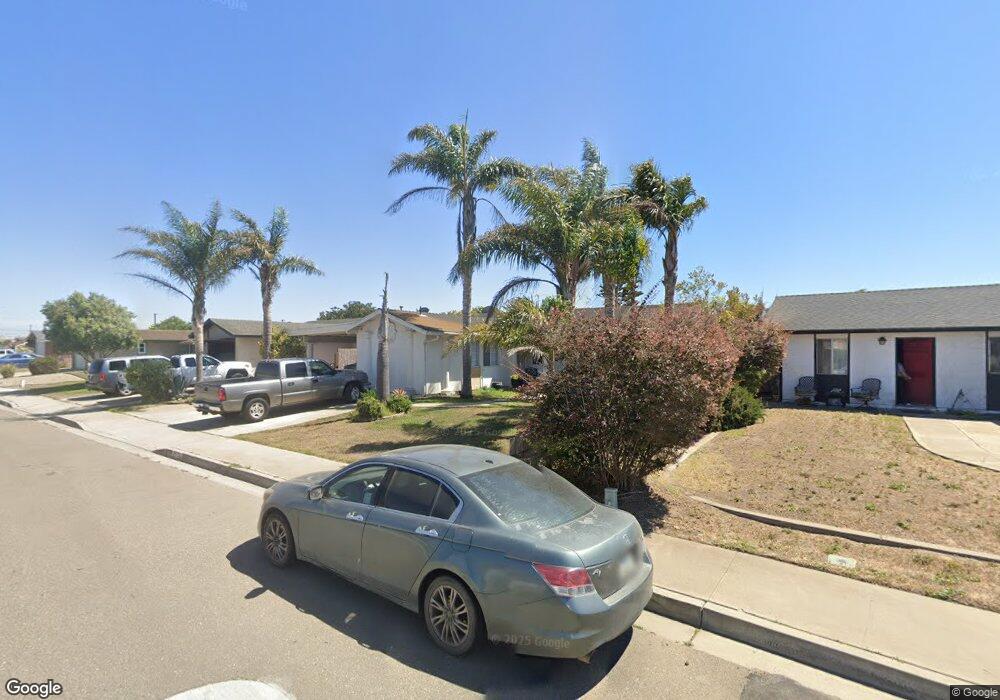
4758 3rd St Guadalupe, CA 93434
Estimated Value: $552,000 - $642,000
4
Beds
3
Baths
1,456
Sq Ft
$409/Sq Ft
Est. Value
About This Home
This home is located at 4758 3rd St, Guadalupe, CA 93434 and is currently estimated at $595,153, approximately $408 per square foot. 4758 3rd St is a home located in Santa Barbara County with nearby schools including Mary Buren Elementary School, Kermit McKenzie Junior High School, and Ernest Righetti High School.
Ownership History
Date
Name
Owned For
Owner Type
Purchase Details
Closed on
Feb 9, 2015
Sold by
Garcia Gerardo G
Bought by
Perez Hollanda
Current Estimated Value
Purchase Details
Closed on
Sep 20, 2005
Sold by
Garcia Gerardo G
Bought by
Garcia Gerardo G and Garcia Martha E
Purchase Details
Closed on
Jul 14, 2005
Sold by
Garcia Martha E
Bought by
Garcia Gerardo G
Home Financials for this Owner
Home Financials are based on the most recent Mortgage that was taken out on this home.
Original Mortgage
$243,500
Interest Rate
5.51%
Mortgage Type
New Conventional
Purchase Details
Closed on
Dec 14, 1993
Sold by
Valdez John and Valdez Rosalie L
Bought by
Garcia Gerardo G and Garcia Martha E
Home Financials for this Owner
Home Financials are based on the most recent Mortgage that was taken out on this home.
Original Mortgage
$51,000
Interest Rate
7.38%
Create a Home Valuation Report for This Property
The Home Valuation Report is an in-depth analysis detailing your home's value as well as a comparison with similar homes in the area
Home Values in the Area
Average Home Value in this Area
Purchase History
| Date | Buyer | Sale Price | Title Company |
|---|---|---|---|
| Perez Hollanda | -- | None Available | |
| Garcia Gerardo G | -- | -- | |
| Garcia Gerardo G | -- | First American Title Company | |
| Garcia Gerardo G | -- | Stewart Title |
Source: Public Records
Mortgage History
| Date | Status | Borrower | Loan Amount |
|---|---|---|---|
| Previous Owner | Garcia Gerardo G | $243,500 | |
| Previous Owner | Garcia Gerardo G | $51,000 |
Source: Public Records
Tax History
| Year | Tax Paid | Tax Assessment Tax Assessment Total Assessment is a certain percentage of the fair market value that is determined by local assessors to be the total taxable value of land and additions on the property. | Land | Improvement |
|---|---|---|---|---|
| 2025 | $2,424 | $212,973 | $76,467 | $136,506 |
| 2023 | $2,424 | $204,705 | $73,499 | $131,206 |
| 2022 | $2,212 | $200,692 | $72,058 | $128,634 |
| 2021 | $2,160 | $196,758 | $70,646 | $126,112 |
| 2020 | $2,160 | $194,741 | $69,922 | $124,819 |
| 2019 | $2,136 | $190,923 | $68,551 | $122,372 |
| 2018 | $2,132 | $187,180 | $67,207 | $119,973 |
| 2017 | $2,101 | $183,511 | $65,890 | $117,621 |
| 2016 | $1,910 | $179,914 | $64,599 | $115,315 |
| 2015 | $1,889 | $177,212 | $63,629 | $113,583 |
| 2014 | $1,852 | $173,742 | $62,383 | $111,359 |
Source: Public Records
Map
Nearby Homes
- 158 Point Sal Dunes Way
- 157 Point Sal Dunes Way
- 211 Las Flores Dr
- 4424 3rd St
- 910 Guadalupe St
- 313 Ninos Dr
- 4429 La Joya Dr
- 1520 California 1
- 981 Trail View Place
- 1016 Trail View Place
- 1335 Riley Ln
- 1155 Aj Ln
- 1035 Gavin Ln
- 1535 Eucalyptus Rd
- 1615 Eucalyptus Rd
- 1066 Trail View Place
- 1590 Eucalyptus Rd
- 867 Trail View Place
- 1658 Eucalyptus Rd
- 0 Indiana Way Unit PI25034009
Your Personal Tour Guide
Ask me questions while you tour the home.