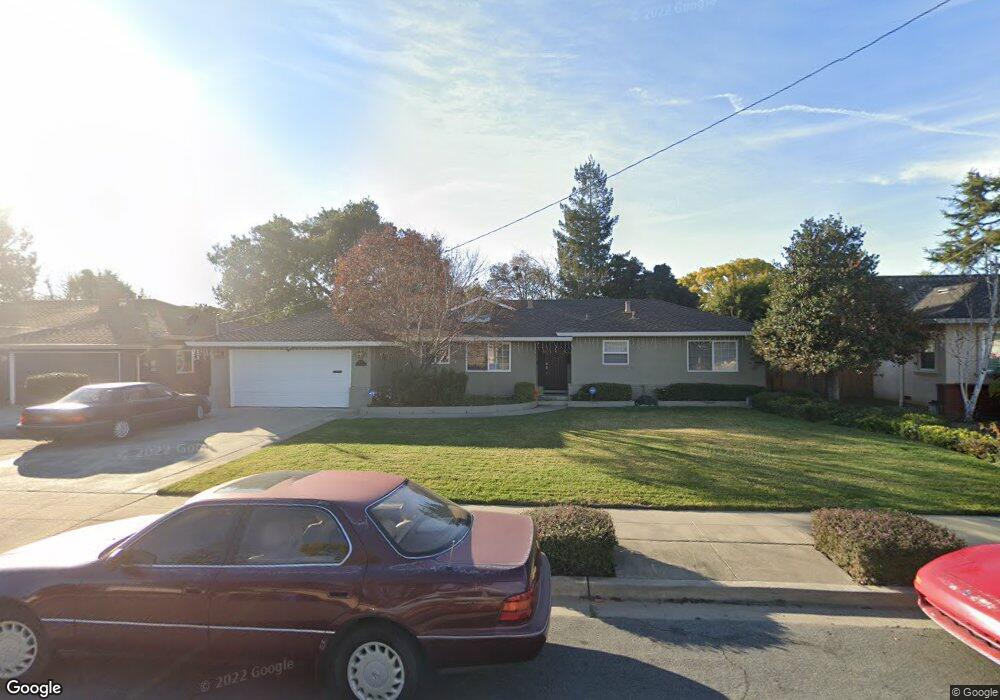
4759 Sterling Dr Fremont, CA 94536
Glenmoor NeighborhoodEstimated Value: $1,831,000 - $2,241,000
3
Beds
3
Baths
2,150
Sq Ft
$930/Sq Ft
Est. Value
About This Home
This home is located at 4759 Sterling Dr, Fremont, CA 94536 and is currently estimated at $1,999,422, approximately $929 per square foot. 4759 Sterling Dr is a home located in Alameda County with nearby schools including Glenmoor Elementary School, Centerville Junior High School, and Washington High School.
Ownership History
Date
Name
Owned For
Owner Type
Purchase Details
Closed on
Aug 19, 2002
Sold by
Gonsalves Linda M
Bought by
Gonsalves Linda M and Linda M Gonsalves 2002 Trust
Current Estimated Value
Purchase Details
Closed on
May 23, 2002
Sold by
Gonsalves Linda M
Bought by
Gonsalves Linda M and Linda M Gonsalves 2002 Trust
Home Financials for this Owner
Home Financials are based on the most recent Mortgage that was taken out on this home.
Original Mortgage
$599,600
Outstanding Balance
$256,747
Interest Rate
7.13%
Estimated Equity
$1,742,675
Purchase Details
Closed on
May 13, 2002
Sold by
Condeff Walter
Bought by
Gonsalves Linda M
Home Financials for this Owner
Home Financials are based on the most recent Mortgage that was taken out on this home.
Original Mortgage
$599,600
Outstanding Balance
$256,747
Interest Rate
7.13%
Estimated Equity
$1,742,675
Create a Home Valuation Report for This Property
The Home Valuation Report is an in-depth analysis detailing your home's value as well as a comparison with similar homes in the area
Home Values in the Area
Average Home Value in this Area
Purchase History
| Date | Buyer | Sale Price | Title Company |
|---|---|---|---|
| Gonsalves Linda M | -- | -- | |
| Gonsalves Linda M | -- | -- | |
| Gonsalves Linda M | $749,500 | Chicago Title Co |
Source: Public Records
Mortgage History
| Date | Status | Borrower | Loan Amount |
|---|---|---|---|
| Open | Gonsalves Linda M | $599,600 | |
| Closed | Gonsalves Linda M | $74,950 |
Source: Public Records
Tax History Compared to Growth
Tax History
| Year | Tax Paid | Tax Assessment Tax Assessment Total Assessment is a certain percentage of the fair market value that is determined by local assessors to be the total taxable value of land and additions on the property. | Land | Improvement |
|---|---|---|---|---|
| 2025 | $13,037 | $1,100,161 | $332,222 | $774,939 |
| 2024 | $13,037 | $1,078,455 | $325,709 | $759,746 |
| 2023 | $12,694 | $1,064,177 | $319,324 | $744,853 |
| 2022 | $12,540 | $1,036,311 | $313,063 | $730,248 |
| 2021 | $12,229 | $1,015,857 | $306,925 | $715,932 |
| 2020 | $12,295 | $1,012,371 | $303,779 | $708,592 |
| 2019 | $12,152 | $992,524 | $297,823 | $694,701 |
| 2018 | $11,916 | $973,067 | $291,985 | $681,082 |
| 2017 | $11,617 | $953,992 | $286,261 | $667,731 |
| 2016 | $11,424 | $935,293 | $280,650 | $654,643 |
| 2015 | $11,277 | $921,247 | $276,435 | $644,812 |
| 2014 | $10,578 | $860,000 | $258,000 | $602,000 |
Source: Public Records
Map
Nearby Homes
- 4948 Norris Rd
- 4715 Eggers Dr
- 38324 Blacow Rd
- 4586 Norris Rd
- 37721 Madera Ct
- 37987 Alta Dr
- 4754 Northdale Dr
- 37621 Glenmoor Dr
- 37792 Colfax Ct
- 5169 Lawler Ave
- 5268 Keeler Ct
- 4328 Cognina Ct
- 4737 Deadwood Dr
- 37659 Granville Dr
- 38265 Corrigan Ct
- 37114 Dondero Way
- Ronda Plan at Marabel
- Sidonia Plan at Marabel
- Sierra Plan at Marabel
- Medina Plan at Marabel
- 4773 Sterling Dr
- 4743 Sterling Dr
- 4774 Norris Rd
- 4812 Norris Rd
- 4807 Sterling Dr
- 4758 Norris Rd
- 4727 Sterling Dr
- 4762 Sterling Dr
- 4730 Sterling Dr
- 4828 Norris Rd
- 4776 Sterling Dr
- 4734 Norris Rd
- 4839 Sterling Dr
- 4711 Sterling Dr
- 4810 Sterling Dr
- 4718 Norris Rd
- 38119 Glendale Dr
- 4844 Norris Rd
- 4825 Norris Rd
- 4855 Sterling Dr