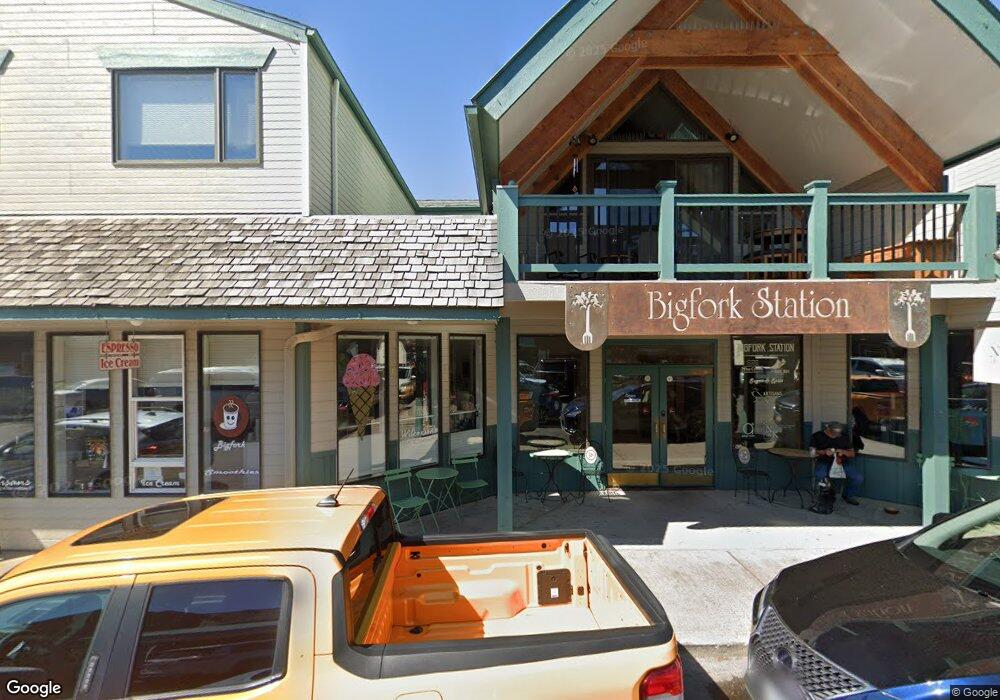
476 Electric Ave Unit A Bigfork, MT 59911
Estimated Value: $2,605,000 - $3,187,000
3
Beds
4
Baths
3,170
Sq Ft
$891/Sq Ft
Est. Value
About This Home
This home is located at 476 Electric Ave Unit A, Bigfork, MT 59911 and is currently estimated at $2,825,668, approximately $891 per square foot. 476 Electric Ave Unit A is a home located in Flathead County with nearby schools including Bigfork Elementary School, Bigfork Middle School, and Bigfork High School.
Ownership History
Date
Name
Owned For
Owner Type
Purchase Details
Closed on
Mar 18, 2014
Sold by
Kjorvestad Lawrence A and Estate Of Rose M Christensen
Bought by
Kjorvestad Lawrence A and Kjorvestad Sharon M
Current Estimated Value
Purchase Details
Closed on
Aug 25, 2008
Sold by
Hewett Deborah and Scott Trey
Bought by
Nelson Barbara Ann
Purchase Details
Closed on
Apr 27, 2006
Sold by
Wg Bigfork Llp
Bought by
Nelson Charles Schreiner
Home Financials for this Owner
Home Financials are based on the most recent Mortgage that was taken out on this home.
Original Mortgage
$875,000
Interest Rate
6.29%
Mortgage Type
New Conventional
Purchase Details
Closed on
Apr 25, 2006
Sold by
Waldenberg Samuel W and Weese Rae Shirleen
Bought by
Wg Bigfork Llp
Home Financials for this Owner
Home Financials are based on the most recent Mortgage that was taken out on this home.
Original Mortgage
$875,000
Interest Rate
6.29%
Mortgage Type
New Conventional
Create a Home Valuation Report for This Property
The Home Valuation Report is an in-depth analysis detailing your home's value as well as a comparison with similar homes in the area
Home Values in the Area
Average Home Value in this Area
Purchase History
| Date | Buyer | Sale Price | Title Company |
|---|---|---|---|
| Kjorvestad Lawrence A | -- | None Available | |
| Nelson Barbara Ann | -- | None Available | |
| Nelson Charles Schreiner | -- | None Available | |
| Wg Bigfork Llp | -- | Sterling Title Services Inc |
Source: Public Records
Mortgage History
| Date | Status | Borrower | Loan Amount |
|---|---|---|---|
| Previous Owner | Nelson Charles Schreiner | $875,000 | |
| Previous Owner | Wg Bigfork Llp | $875,000 |
Source: Public Records
Tax History
| Year | Tax Paid | Tax Assessment Tax Assessment Total Assessment is a certain percentage of the fair market value that is determined by local assessors to be the total taxable value of land and additions on the property. | Land | Improvement |
|---|---|---|---|---|
| 2025 | $15,607 | $2,522,500 | $0 | $0 |
| 2024 | $7,842 | $1,402,300 | $0 | $0 |
| 2023 | $8,110 | $1,402,300 | $0 | $0 |
| 2022 | $9,636 | $1,338,700 | $0 | $0 |
| 2021 | $10,311 | $1,338,700 | $0 | $0 |
| 2020 | $14,026 | $1,723,471 | $0 | $0 |
| 2019 | $13,538 | $1,723,471 | $0 | $0 |
| 2018 | $15,093 | $1,838,410 | $0 | $0 |
| 2017 | $14,778 | $1,838,410 | $0 | $0 |
| 2016 | $14,324 | $1,794,518 | $0 | $0 |
| 2015 | $13,371 | $1,794,518 | $0 | $0 |
| 2014 | $11,716 | $957,710 | $0 | $0 |
Source: Public Records
Map
Nearby Homes
- 464 Electric Ave Unit C
- 443 Osborn Ave Unit 210
- 380 Commerce St
- 380&374 Commerce St
- 370 Commerce St
- 215 Whisper Ridge Dr
- 180 Vista Ln Unit 137
- 180 Vista Ln Unit 111
- 180 Vista Ln Unit 254
- 180 Vista Ln Unit 301
- 151 Whisper Ridge Dr
- 150 Whisper Ridge Dr
- 8575 Mt Highway 35 Unit 11
- 667 Commerce St
- 8615 Mt Hwy 35
- 8615 Montana Hwy 35
- 74 Trails End Ct
- 62 Trails End Ct
- 150 Trading Post Trail
- 162 Trading Post Trail
- 476 Electric Ave
- 476 Electric Ave Unit : C
- 476 Electric Ave Unit C
- 476 Electric Ave Unit A
- 476 Electric Ave Bigfork Flathead Co
- 464D Electric Ave
- 464C Electric Ave
- 474 Electric Ave Unit D
- 474 Electric Ave
- 474 Electric Ave Unit B
- 474 Electric Ave
- 474 Electric Ave
- 474 Electric Ave Unit B
- 474 Electric Ave Unit D
- 464 Electric Ave
- 464 D Electric Ave
- 464 Electric Ave Unit D
- 464 Electric Ave Unit C
- 350 River St
- 508, 512 Electric Ave
Your Personal Tour Guide
Ask me questions while you tour the home.