4767 108th Ave Pullman, MI 49450
Estimated Value: $48,755 - $180,000
Studio
--
Bath
924
Sq Ft
$123/Sq Ft
Est. Value
About This Home
This home is located at 4767 108th Ave, Pullman, MI 49450 and is currently estimated at $113,939, approximately $123 per square foot. 4767 108th Ave is a home with nearby schools including Pine Trails Elementary School, L.E. White Middle School, and Allegan High School.
Ownership History
Date
Name
Owned For
Owner Type
Purchase Details
Closed on
Jun 13, 2022
Sold by
Delores M Mckenney Revocable Living Trus
Bought by
Ellis Sean
Current Estimated Value
Purchase Details
Closed on
Oct 1, 2001
Sold by
Williams Richard A and Williams Margaret A
Bought by
Delores M Mckenney Revocable Living Tr
Purchase Details
Closed on
Apr 5, 1999
Sold by
Williams Sylvia
Bought by
Williams Richard and Williams Margaret
Purchase Details
Closed on
Nov 12, 1998
Sold by
Green James and Green Frances J
Bought by
Williams Sylvia
Purchase Details
Closed on
Jun 6, 1997
Sold by
Green George D
Bought by
Green James and Green Frances J
Create a Home Valuation Report for This Property
The Home Valuation Report is an in-depth analysis detailing your home's value as well as a comparison with similar homes in the area
Purchase History
| Date | Buyer | Sale Price | Title Company |
|---|---|---|---|
| Ellis Sean | $35,000 | Mckenney Patti L | |
| Delores M Mckenney Revocable Living Tr | $32,500 | Chicago Title Of Michigan In | |
| Williams Richard | -- | -- | |
| Williams Sylvia | $3,500 | -- | |
| Green James | -- | -- |
Source: Public Records
Tax History
| Year | Tax Paid | Tax Assessment Tax Assessment Total Assessment is a certain percentage of the fair market value that is determined by local assessors to be the total taxable value of land and additions on the property. | Land | Improvement |
|---|---|---|---|---|
| 2025 | $853 | $29,700 | $17,300 | $12,400 |
| 2024 | -- | $25,800 | $15,300 | $10,500 |
| 2023 | $428 | $22,000 | $13,000 | $9,000 |
| 2020 | $428 | $17,800 | $9,500 | $8,300 |
| 2019 | $503 | $15,200 | $7,600 | $7,600 |
| 2018 | $0 | $15,900 | $7,600 | $8,300 |
| 2017 | $0 | $13,000 | $5,500 | $7,500 |
| 2016 | $0 | $9,400 | $4,800 | $4,600 |
| 2015 | -- | $9,400 | $4,800 | $4,600 |
| 2014 | -- | $12,200 | $6,200 | $6,000 |
| 2013 | -- | $11,600 | $5,700 | $5,900 |
Source: Public Records
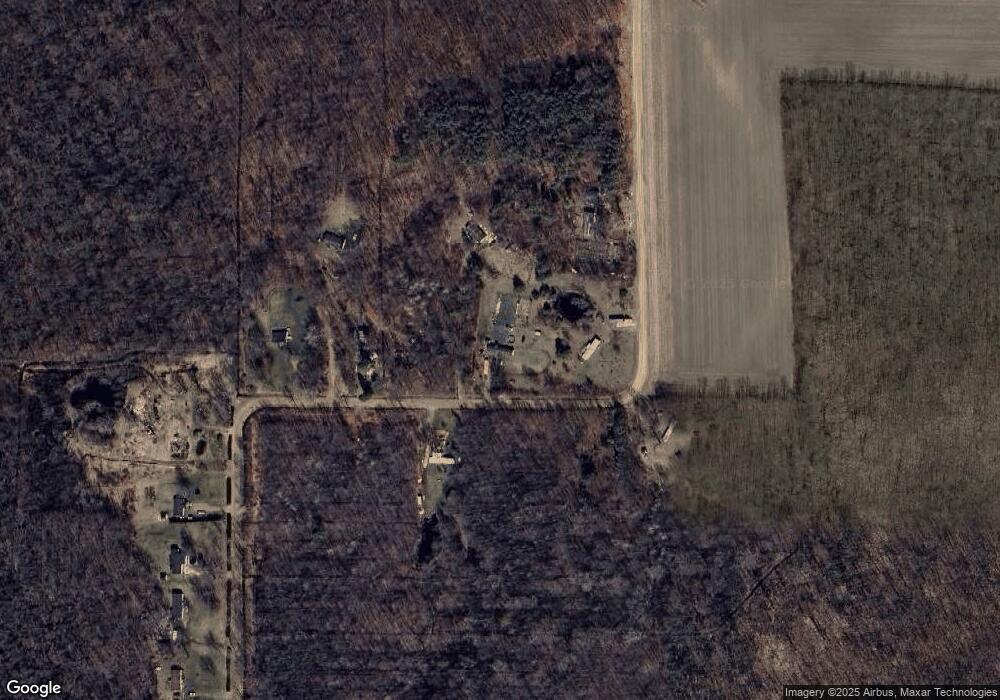
Map
Nearby Homes
Your Personal Tour Guide
Ask me questions while you tour the home.