4769 Canterbury Ct Unit 2 Oceanside, CA 92056
Peacock NeighborhoodEstimated Value: $509,942 - $560,000
2
Beds
1
Bath
873
Sq Ft
$621/Sq Ft
Est. Value
About This Home
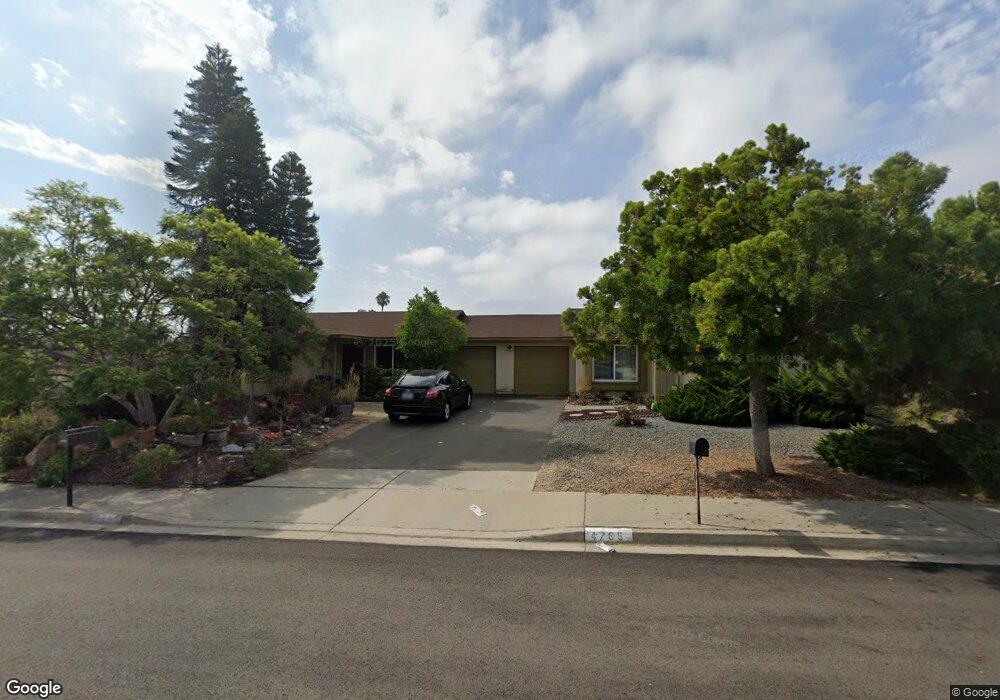
This home is located at 4769 Canterbury Ct Unit 2, Oceanside, CA 92056 and is currently estimated at $541,736, approximately $620 per square foot. 4769 Canterbury Ct Unit 2 is a home located in San Diego County with nearby schools including T.H.E Leadership Academy, Roosevelt Middle School, and Vista High School.
Ownership History
Date
Name
Owned For
Owner Type
Purchase Details
Closed on
Nov 13, 2009
Sold by
Vankirk Terry
Bought by
Vankirk Terry
Current Estimated Value
Purchase Details
Closed on
Aug 27, 2003
Sold by
Salem Max F
Bought by
Vankirk Terry
Home Financials for this Owner
Home Financials are based on the most recent Mortgage that was taken out on this home.
Original Mortgage
$157,200
Outstanding Balance
$69,195
Interest Rate
5.5%
Mortgage Type
Unknown
Estimated Equity
$472,541
Purchase Details
Closed on
Aug 24, 2002
Sold by
Salem Barbara
Bought by
Salem Max F
Home Financials for this Owner
Home Financials are based on the most recent Mortgage that was taken out on this home.
Original Mortgage
$82,500
Interest Rate
6.43%
Purchase Details
Closed on
Mar 11, 1987
Create a Home Valuation Report for This Property
The Home Valuation Report is an in-depth analysis detailing your home's value as well as a comparison with similar homes in the area
Home Values in the Area
Average Home Value in this Area
Purchase History
| Date | Buyer | Sale Price | Title Company |
|---|---|---|---|
| Vankirk Terry | -- | None Available | |
| Vankirk Terry | $196,500 | New Century Title Company | |
| Salem Max F | -- | Gateway Title Company | |
| -- | $67,000 | -- |
Source: Public Records
Mortgage History
| Date | Status | Borrower | Loan Amount |
|---|---|---|---|
| Open | Vankirk Terry | $157,200 | |
| Previous Owner | Salem Max F | $82,500 | |
| Closed | Vankirk Terry | $39,300 |
Source: Public Records
Tax History Compared to Growth
Tax History
| Year | Tax Paid | Tax Assessment Tax Assessment Total Assessment is a certain percentage of the fair market value that is determined by local assessors to be the total taxable value of land and additions on the property. | Land | Improvement |
|---|---|---|---|---|
| 2025 | $2,968 | $279,372 | $213,264 | $66,108 |
| 2024 | $2,968 | $273,895 | $209,083 | $64,812 |
| 2023 | $2,895 | $268,526 | $204,984 | $63,542 |
| 2022 | $2,886 | $263,262 | $200,965 | $62,297 |
| 2021 | $2,821 | $258,101 | $197,025 | $61,076 |
| 2020 | $2,811 | $255,455 | $195,005 | $60,450 |
| 2019 | $2,769 | $250,447 | $191,182 | $59,265 |
| 2018 | $2,632 | $245,537 | $187,434 | $58,103 |
| 2017 | $2,583 | $240,723 | $183,759 | $56,964 |
| 2016 | $2,520 | $236,004 | $180,156 | $55,848 |
| 2015 | $2,374 | $220,000 | $166,000 | $54,000 |
| 2014 | $1,930 | $180,000 | $136,000 | $44,000 |
Source: Public Records
Map
Nearby Homes
- 1529 Temple Heights Dr
- 1523 Temple Heights Dr
- 1460 Highridge Dr
- 4712 Rim Rock Rd
- 1441 Peacock Blvd
- 4708 Sunrise Ridge
- 1385 Temple Heights Dr
- 1426 Westwood Place
- 1736 Round Tree Dr
- 4867 Meadowbrook Dr
- 1463 Westmore Place
- 1366 Panorama Ridge Rd
- 1702 Havenwood Dr Unit 1087D4
- 4543 Beverly Glen Dr
- 4549 Quailridge Dr
- 1609 Fig Tree Way
- 5014 Palmera Dr
- 1909 Cheyenne Cir
- 1911 Cheyenne Cir
- 1314 Woodview Dr
- 4765 Canterbury Ct
- 1531 Rolling Hills Dr
- 4761 Canterbury Ct
- 1535 Rolling Hills Dr
- 1526 Rolling Hills Dr
- 4757 Canterbury Ct
- 1528 Rolling Hills Dr
- 1524 Rolling Hills Dr
- 1530 Rolling Hills Dr
- 1522 Rolling Hills Dr
- 4762 Rising Glen Dr
- 1543 Rolling Hills Dr
- 1520 Rolling Hills Dr
- 4754 Canterbury Ct
- 4753 Canterbury Ct
- 4753 Canterbury Ct Unit 2
- 4753 Canterbury Ct
- 1532 Rolling Hills Dr
- 4760 Rising Glen Dr
- 4752 Canterbury Ct