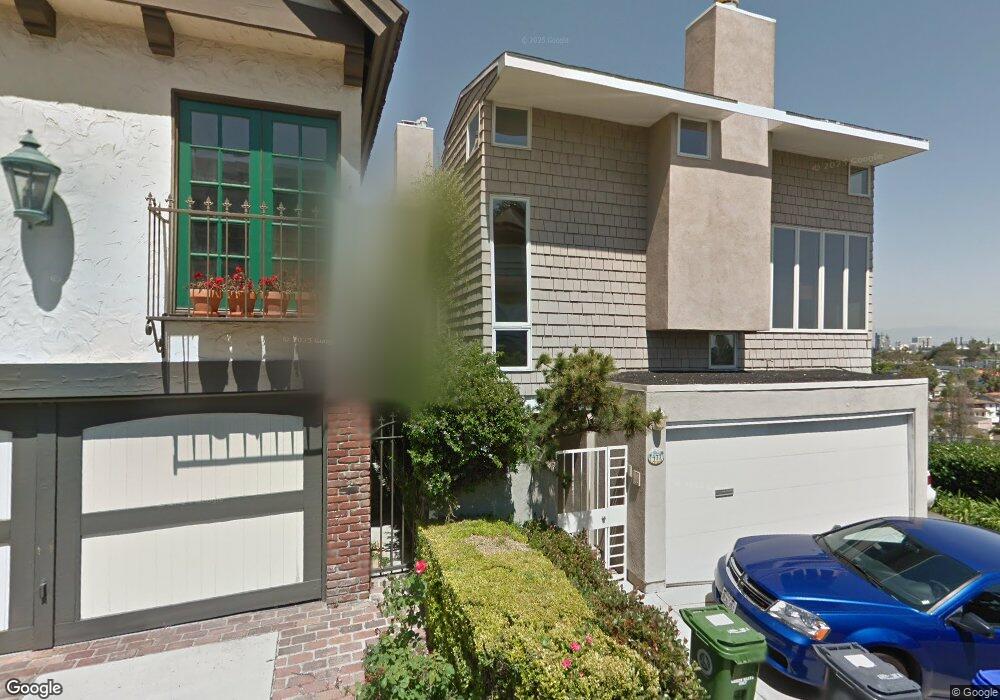
477 28th St Manhattan Beach, CA 90266
Estimated Value: $2,948,086 - $3,663,000
4
Beds
3
Baths
2,777
Sq Ft
$1,174/Sq Ft
Est. Value
About This Home
This home is located at 477 28th St, Manhattan Beach, CA 90266 and is currently estimated at $3,260,022, approximately $1,173 per square foot. 477 28th St is a home located in Los Angeles County with nearby schools including Grand View Elementary School, Manhattan Beach Middle School, and Mira Costa High School.
Ownership History
Date
Name
Owned For
Owner Type
Purchase Details
Closed on
Oct 24, 2013
Sold by
Savaiano Sandra A
Bought by
Savaiano Sandra A and The Sandra A Savaiano 1996 Revocable Tru
Current Estimated Value
Purchase Details
Closed on
Jan 20, 2003
Sold by
Savaiano Sandra A and The Sandra A Savaiano 1996 Rev
Bought by
Savaiano Sandra A
Home Financials for this Owner
Home Financials are based on the most recent Mortgage that was taken out on this home.
Original Mortgage
$311,000
Interest Rate
5.96%
Purchase Details
Closed on
Feb 9, 1996
Sold by
Savaiano Sandra A
Bought by
Savaiano Sandra A and The Sandra A Savaiano 1996 Revocable Tr
Create a Home Valuation Report for This Property
The Home Valuation Report is an in-depth analysis detailing your home's value as well as a comparison with similar homes in the area
Home Values in the Area
Average Home Value in this Area
Purchase History
| Date | Buyer | Sale Price | Title Company |
|---|---|---|---|
| Savaiano Sandra A | -- | None Available | |
| Savaiano Sandra A | -- | Commerce Title | |
| Savaiano Sandra A | -- | -- |
Source: Public Records
Mortgage History
| Date | Status | Borrower | Loan Amount |
|---|---|---|---|
| Closed | Savaiano Sandra A | $311,000 |
Source: Public Records
Tax History
| Year | Tax Paid | Tax Assessment Tax Assessment Total Assessment is a certain percentage of the fair market value that is determined by local assessors to be the total taxable value of land and additions on the property. | Land | Improvement |
|---|---|---|---|---|
| 2025 | $4,772 | $401,042 | $115,914 | $285,128 |
| 2024 | $4,772 | $393,180 | $113,642 | $279,538 |
| 2023 | $4,599 | $385,471 | $111,414 | $274,057 |
| 2022 | $4,522 | $377,914 | $109,230 | $268,684 |
| 2021 | $4,484 | $370,505 | $107,089 | $263,416 |
| 2019 | $4,366 | $359,516 | $103,913 | $255,603 |
| 2018 | $4,244 | $352,468 | $101,876 | $250,592 |
| 2016 | $3,964 | $338,783 | $97,921 | $240,862 |
| 2015 | $3,885 | $333,696 | $96,451 | $237,245 |
| 2014 | $3,841 | $327,160 | $94,562 | $232,598 |
Source: Public Records
Map
Nearby Homes
- 461 26th St
- 448 23rd Place
- 320 31st St
- 436 32nd St
- 323 31st St
- 221 30th St
- 316 32nd St
- 3204 Crest Dr
- 605 Marine Ave
- 2420 The Strand
- 612 33rd St
- 3205 Bayview Dr
- 3208 Manhattan Ave
- 2208 The Strand
- 2200 The Strand Unit A
- 2200 The Strand Unit B
- 127 21st St
- 2007 Highland Ave
- 1940 N Ardmore Ave
- 3216 The Strand
Your Personal Tour Guide
Ask me questions while you tour the home.