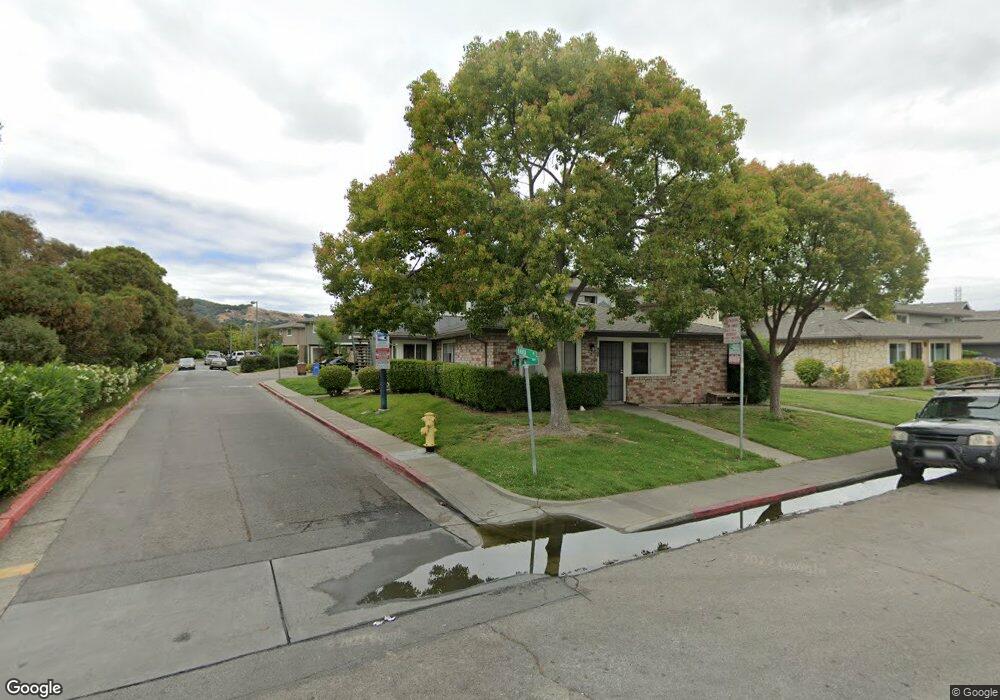
477 Bahia Way Unit 4 San Rafael, CA 94901
Canal NeighborhoodEstimated Value: $406,928 - $446,000
2
Beds
1
Bath
840
Sq Ft
$506/Sq Ft
Est. Value
About This Home
This home is located at 477 Bahia Way Unit 4, San Rafael, CA 94901 and is currently estimated at $424,732, approximately $505 per square foot. 477 Bahia Way Unit 4 is a home located in Marin County with nearby schools including Bahia Vista Elementary School, James B. Davidson Middle School, and San Rafael High School.
Ownership History
Date
Name
Owned For
Owner Type
Purchase Details
Closed on
Sep 29, 2021
Sold by
Namiranian Meherdad and Namiranian Parisa
Bought by
Namiranian Meherdad K and Namiranian Parisa
Current Estimated Value
Purchase Details
Closed on
Feb 23, 2004
Sold by
Ho Tu Doan and Nguyen Thanh My
Bought by
Namiranian Meherdad and Namiranian Parisa
Home Financials for this Owner
Home Financials are based on the most recent Mortgage that was taken out on this home.
Original Mortgage
$211,800
Outstanding Balance
$97,813
Interest Rate
5.61%
Mortgage Type
Unknown
Estimated Equity
$326,919
Purchase Details
Closed on
Oct 2, 2000
Sold by
Angel Susan M and Angel Jerald J
Bought by
Ho Tu Doan and Nguyen Thanh My
Home Financials for this Owner
Home Financials are based on the most recent Mortgage that was taken out on this home.
Original Mortgage
$157,937
Interest Rate
8.01%
Mortgage Type
Stand Alone First
Create a Home Valuation Report for This Property
The Home Valuation Report is an in-depth analysis detailing your home's value as well as a comparison with similar homes in the area
Home Values in the Area
Average Home Value in this Area
Purchase History
| Date | Buyer | Sale Price | Title Company |
|---|---|---|---|
| Namiranian Meherdad K | -- | None Available | |
| Namiranian Meherdad | $282,500 | Old Republic Title Company | |
| Ho Tu Doan | $180,500 | Old Republic Title Company | |
| Angel Jerald J | -- | Old Republic Title Company |
Source: Public Records
Mortgage History
| Date | Status | Borrower | Loan Amount |
|---|---|---|---|
| Open | Namiranian Meherdad | $211,800 | |
| Previous Owner | Ho Tu Doan | $157,937 |
Source: Public Records
Tax History Compared to Growth
Tax History
| Year | Tax Paid | Tax Assessment Tax Assessment Total Assessment is a certain percentage of the fair market value that is determined by local assessors to be the total taxable value of land and additions on the property. | Land | Improvement |
|---|---|---|---|---|
| 2025 | $6,715 | $401,633 | $220,365 | $181,268 |
| 2024 | $6,715 | $393,759 | $216,045 | $177,714 |
| 2023 | $6,545 | $386,039 | $211,809 | $174,230 |
| 2022 | $6,231 | $378,470 | $207,656 | $170,814 |
| 2021 | $6,134 | $371,052 | $203,586 | $167,466 |
| 2020 | $6,039 | $367,250 | $201,500 | $165,750 |
| 2019 | $5,661 | $345,000 | $151,500 | $193,500 |
| 2018 | $4,968 | $285,000 | $125,000 | $160,000 |
| 2017 | $4,470 | $250,775 | $110,341 | $140,434 |
| 2016 | $4,146 | $232,200 | $102,168 | $130,032 |
| 2015 | $3,815 | $215,000 | $94,600 | $120,400 |
| 2014 | $2,922 | $145,600 | $64,064 | $81,536 |
Source: Public Records
Map
Nearby Homes
- 3665 Kerner Blvd Unit B
- 3665 Kerner Blvd Unit D
- 22 Fairfax St Unit B
- 231 Playa Del Rey
- 35 Fairfax St Unit 8
- 163 Bahia Cir
- 199 Canal St Unit 6
- 120 Canal St
- 80 Baypoint Dr
- 139 Nantucket Cove
- 110 Baypoint Dr Unit 2
- 55 Dowitcher Way
- 124 Baypoint Dr
- 20 Porto Bello Dr
- 13 Hingham Cove
- 29 Porto Bello Dr
- 48 Porto Bello Dr
- 9 Porto Bello Dr
- 21 Marina Blvd
- 56 Mooring Rd Unit 2
- 473 Bahia Way
- 475 Bahia Way
- 471 Bahia Way Unit 501
- 465 Bahia Way Unit 493
- 467 Bahia Way
- 463 Bahia Way
- 461 Bahia Way
- 279 Bahia Ln
- 275 Bahia Ln
- 277 Bahia Ln Unit 533
- 453 Bahia Way Unit 2
- 483 Bahia Way Unit 2
- 287 Bahia Ln Unit 4
- 457 Bahia Way
- 273 Bahia Ln Unit 1
- 487 Bahia Way
- 481 Bahia Way
- 451 Bahia Way
- 285 Bahia Ln
- 455 Bahia Way