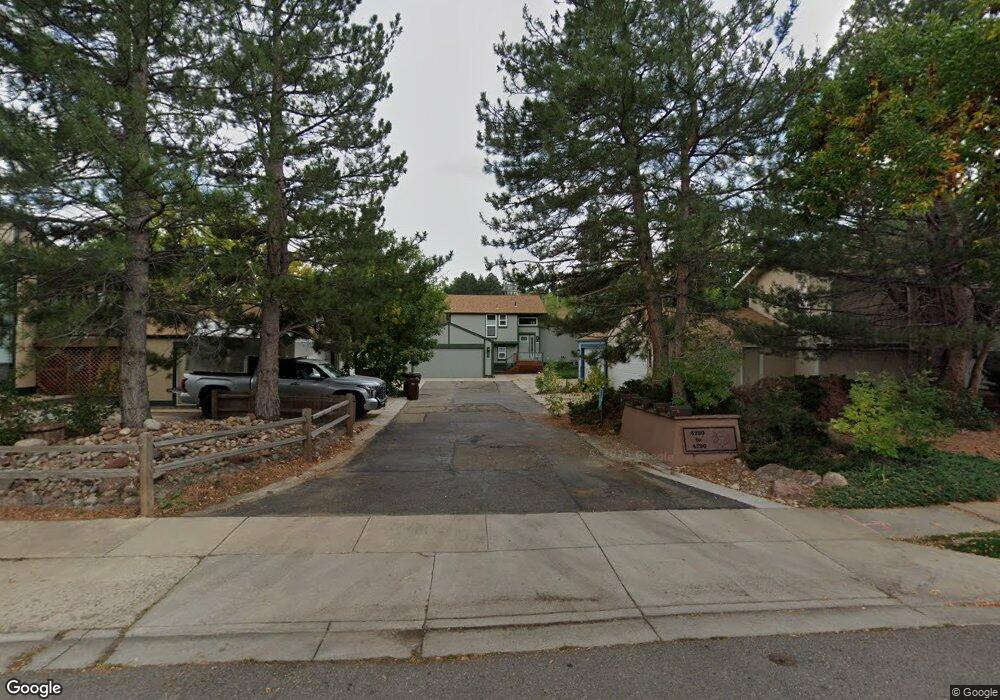
4770 W Moorhead Cir Boulder, CO 80305
South Boulder NeighborhoodEstimated Value: $720,000 - $1,023,000
2
Beds
2
Baths
1,126
Sq Ft
$798/Sq Ft
Est. Value
About This Home
This home is located at 4770 W Moorhead Cir, Boulder, CO 80305 and is currently estimated at $898,849, approximately $798 per square foot. 4770 W Moorhead Cir is a home located in Boulder County with nearby schools including Creekside Elementary School, Southern Hills Middle School, and Fairview High School.
Ownership History
Date
Name
Owned For
Owner Type
Purchase Details
Closed on
Apr 21, 2020
Sold by
Taht Laura J and Laura J Taht Living Trust
Bought by
Taht Laura J and Mccarthy Linda G
Current Estimated Value
Purchase Details
Closed on
Oct 13, 2005
Sold by
Taht Laura J
Bought by
Taht Living Trust
Purchase Details
Closed on
Jul 17, 2000
Sold by
South Creek Seven Homeowners Assn
Bought by
Wilson Ellen
Purchase Details
Closed on
Dec 15, 1993
Sold by
Mcstain Enterprises Inc
Bought by
South Creek 7 Homeowners Assn
Purchase Details
Closed on
Apr 6, 1990
Bought by
Taht Living Trust
Purchase Details
Closed on
Nov 13, 1987
Bought by
Taht Living Trust
Purchase Details
Closed on
Jan 19, 1984
Bought by
Taht Living Trust
Purchase Details
Closed on
Aug 16, 1979
Bought by
Taht Living Trust
Create a Home Valuation Report for This Property
The Home Valuation Report is an in-depth analysis detailing your home's value as well as a comparison with similar homes in the area
Home Values in the Area
Average Home Value in this Area
Purchase History
| Date | Buyer | Sale Price | Title Company |
|---|---|---|---|
| Taht Laura J | -- | None Available | |
| Taht Living Trust | -- | -- | |
| Wilson Ellen | -- | -- | |
| South Creek 7 Homeowners Assn | -- | -- | |
| Taht Living Trust | $104,000 | -- | |
| Taht Living Trust | $99,000 | -- | |
| Taht Living Trust | $95,000 | -- | |
| Taht Living Trust | $78,400 | -- |
Source: Public Records
Tax History Compared to Growth
Tax History
| Year | Tax Paid | Tax Assessment Tax Assessment Total Assessment is a certain percentage of the fair market value that is determined by local assessors to be the total taxable value of land and additions on the property. | Land | Improvement |
|---|---|---|---|---|
| 2025 | $5,334 | $56,313 | $27,319 | $28,994 |
| 2024 | $5,334 | $56,313 | $27,319 | $28,994 |
| 2023 | $5,241 | $60,689 | $31,993 | $32,381 |
| 2022 | $4,920 | $52,174 | $23,971 | $28,203 |
| 2021 | $4,695 | $53,675 | $24,660 | $29,015 |
| 2020 | $4,389 | $50,422 | $23,381 | $27,041 |
| 2019 | $4,322 | $50,422 | $23,381 | $27,041 |
| 2018 | $3,951 | $45,576 | $21,240 | $24,336 |
| 2017 | $3,828 | $50,387 | $23,482 | $26,905 |
| 2016 | $3,135 | $36,218 | $20,298 | $15,920 |
| 2015 | $2,969 | $32,087 | $13,771 | $18,316 |
| 2014 | $2,698 | $32,087 | $13,771 | $18,316 |
Source: Public Records
Map
Nearby Homes
- 4814 W Moorhead Cir
- 4733 W Moorhead Cir
- 1019 Tantra Park Cir
- 860 W Moorhead Cir Unit I
- 860 W Moorhead Cir Unit 2K
- 860 W Moorhead Cir Unit 2H
- 850 W Moorhead Cir Unit 3L
- 800 W Moorhead Cir Unit E
- 750 W Moorhead Cir Unit A
- 4630 MacKy Way
- 4763 Tantra Dr Unit B
- 4475 Hastings Dr
- 611 Tantra Dr
- 725 S 45th St
- 4350 Butler Cir
- 1533 Bradley Dr
- 960 Toedtli Dr
- 1596 Bradley Dr Unit 105C
- 3360 S Broadway
- 1720 S Marshall Rd Unit 24
- 4760 W Moorhead Cir
- 4780 W Moorhead Cir
- 4750 W Moorhead Cir
- 4790 W Moorhead Cir
- 4730 W Moorhead Cir
- 4808 W Moorhead Cir
- 4740 W Moorhead Cir
- 4722 W Moorhead Cir
- 4803 W Moorhead Cir
- 4777 W Moorhead Cir
- 4804 W Moorhead Cir
- 4775 W Moorhead Cir
- 4807 W Moorhead Cir
- 4807 W Moorhead Cir
- 4818 W Moorhead Cir
- 4767 W Moorhead Cir
- 4809 W Moorhead Cir
- 4775R W Moorhead Cir
- 4763 W Moorhead Cir
- 4811 W Moorhead Cir