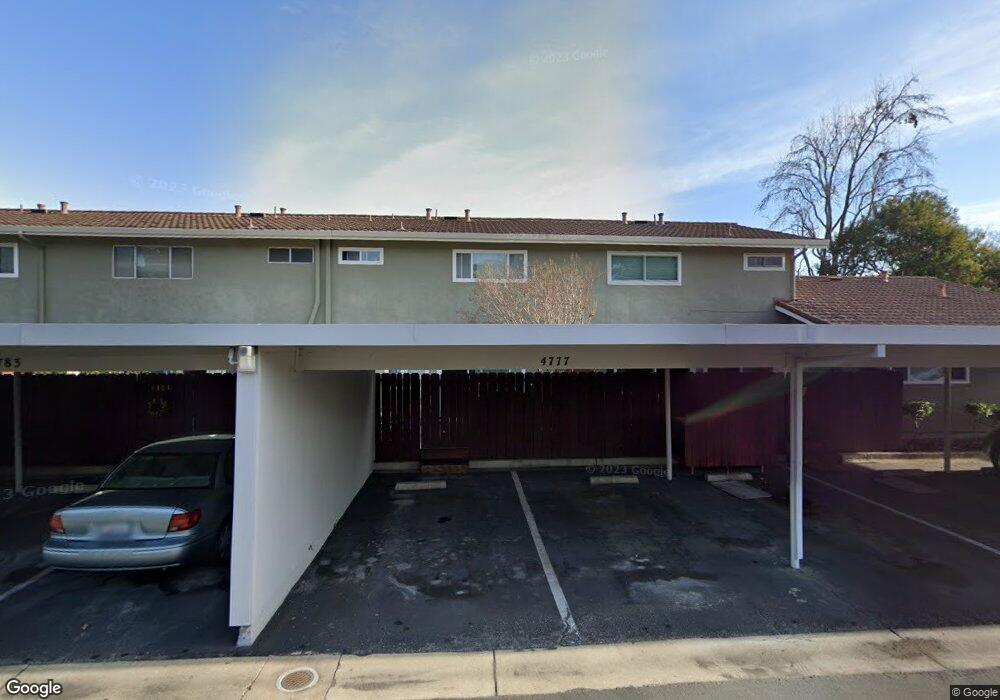
4777 Saginaw Cir Pleasanton, CA 94588
Stoneridge NeighborhoodEstimated Value: $668,000 - $717,000
3
Beds
2
Baths
1,130
Sq Ft
$613/Sq Ft
Est. Value
About This Home
This home is located at 4777 Saginaw Cir, Pleasanton, CA 94588 and is currently estimated at $692,736, approximately $613 per square foot. 4777 Saginaw Cir is a home located in Alameda County with nearby schools including Fairlands Elementary School, Thomas S. Hart Middle School, and Amador Valley High School.
Ownership History
Date
Name
Owned For
Owner Type
Purchase Details
Closed on
Oct 6, 2017
Sold by
Schew Lai
Bought by
Chew Lai Ying and The Lai Ying Chew Family Trust
Current Estimated Value
Purchase Details
Closed on
Apr 2, 2008
Sold by
Kennerson Ambrina and Khan Ambrina
Bought by
Chew Lai and Chew Dennis
Home Financials for this Owner
Home Financials are based on the most recent Mortgage that was taken out on this home.
Original Mortgage
$342,000
Interest Rate
5.5%
Mortgage Type
Purchase Money Mortgage
Purchase Details
Closed on
Jun 21, 2004
Sold by
May Phyllis A
Bought by
Khan Ambrina
Home Financials for this Owner
Home Financials are based on the most recent Mortgage that was taken out on this home.
Original Mortgage
$284,000
Interest Rate
5.37%
Mortgage Type
Purchase Money Mortgage
Create a Home Valuation Report for This Property
The Home Valuation Report is an in-depth analysis detailing your home's value as well as a comparison with similar homes in the area
Home Values in the Area
Average Home Value in this Area
Purchase History
| Date | Buyer | Sale Price | Title Company |
|---|---|---|---|
| Chew Lai Ying | -- | None Available | |
| Chew Lai | $427,500 | Fidelity National Title Co | |
| Kennerson Ambrina | -- | Fidelity National Title Co | |
| Khan Ambrina | $355,000 | Ticor Title Company Of Ca | |
| May Phyllis A | -- | Ticor Title Company Of Ca |
Source: Public Records
Mortgage History
| Date | Status | Borrower | Loan Amount |
|---|---|---|---|
| Previous Owner | Chew Lai | $342,000 | |
| Previous Owner | Khan Ambrina | $284,000 | |
| Closed | Khan Ambrina | $35,500 |
Source: Public Records
Tax History Compared to Growth
Tax History
| Year | Tax Paid | Tax Assessment Tax Assessment Total Assessment is a certain percentage of the fair market value that is determined by local assessors to be the total taxable value of land and additions on the property. | Land | Improvement |
|---|---|---|---|---|
| 2025 | $6,532 | $561,490 | $168,447 | $393,043 |
| 2024 | $6,532 | $550,482 | $165,144 | $385,338 |
| 2023 | $6,457 | $539,692 | $161,907 | $377,785 |
| 2022 | $6,118 | $529,111 | $158,733 | $370,378 |
| 2021 | $5,962 | $518,740 | $155,622 | $363,118 |
| 2020 | $5,886 | $513,422 | $154,026 | $359,396 |
| 2019 | $5,957 | $503,358 | $151,007 | $352,351 |
| 2018 | $5,837 | $493,492 | $148,047 | $345,445 |
| 2017 | $5,689 | $483,818 | $145,145 | $338,673 |
| 2016 | $5,250 | $474,331 | $142,299 | $332,032 |
| 2015 | $5,153 | $467,210 | $140,163 | $327,047 |
| 2014 | $4,973 | $434,000 | $130,200 | $303,800 |
Source: Public Records
Map
Nearby Homes
- 4446 Seminole Way Unit 1
- 4385 Diavila Ave
- 4380 Diavila Ave
- 4327 Fairlands Dr
- 4832 Knox Gate Ct
- 5740 Belleza Dr
- 2474 Tanager Dr
- 4068 Ghiotti Ct
- 2229 Delucchi Dr
- 4165 Cortina Ct
- 3958 W Las Positas Blvd
- 4251 Lucero Ct
- 2589 Larrikeet Ct
- 3910 Rockingham Dr
- 3299 Runnymede Ct
- 3734 Kamp Dr
- 1817 Sinclair Dr
- 3431 Windsor Ct
- 5885 Bruce Dr
- 2320 Sandpiper Way
- 4783 Saginaw Cir
- 4771 Saginaw Cir
- 4789 Saginaw CI
- 4789 Saginaw Cir
- 4765 Saginaw Cir
- 4795 Saginaw Cir
- 4831 Saginaw Cir
- 4837 Saginaw Cir
- 4753 Saginaw Cir
- 4747 Saginaw Cir
- 4843 Saginaw Cir
- 4759 Saginaw Cir
- 4741 Saginaw Cir
- 4735 Saginaw Cir
- 4849 Saginaw Cir
- 4729 Saginaw Cir
- 4713 Saginaw Cir
- 4707 Saginaw Cir
- 4814 Saginaw Cir
- 4808 Saginaw Cir