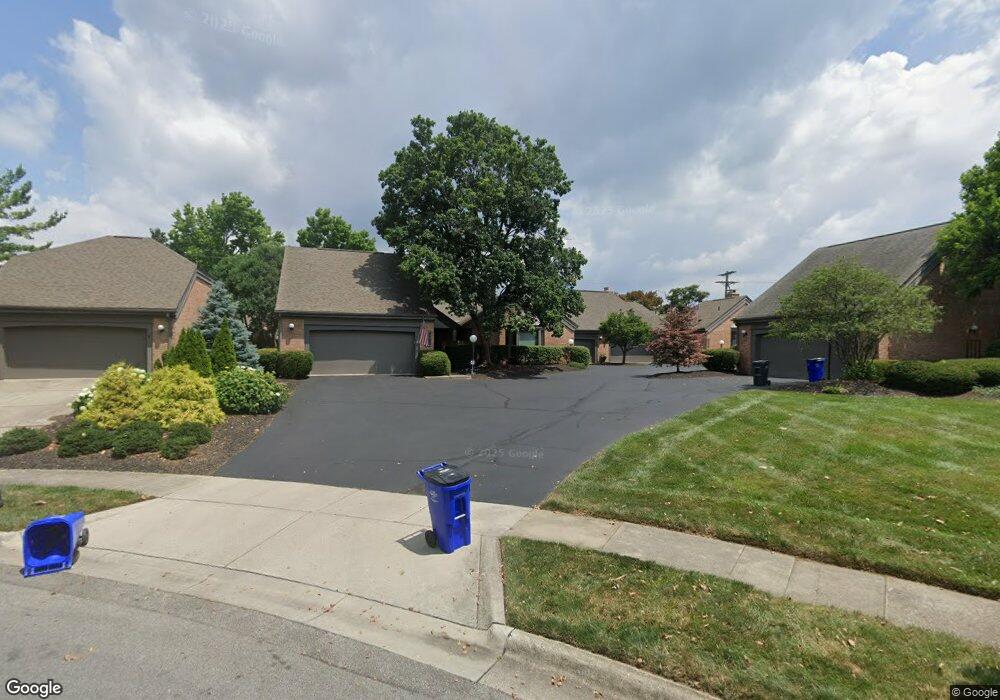
4778 Dierker Rd Unit D Columbus, OH 43220
Estimated Value: $367,000 - $433,000
2
Beds
2
Baths
1,519
Sq Ft
$260/Sq Ft
Est. Value
About This Home
This home is located at 4778 Dierker Rd Unit D, Columbus, OH 43220 and is currently estimated at $395,098, approximately $260 per square foot. 4778 Dierker Rd Unit D is a home located in Franklin County with nearby schools including Greensview Elementary School, Hastings Middle School, and Upper Arlington High School.
Ownership History
Date
Name
Owned For
Owner Type
Purchase Details
Closed on
Aug 21, 2014
Sold by
Dorsey Beth A
Bought by
Dorsey Beth A and Beth A Dorsey Family Trust
Current Estimated Value
Purchase Details
Closed on
Mar 20, 2000
Sold by
Maxwell Thomas V and Schab Stephen M
Bought by
Dorsey Beth A
Home Financials for this Owner
Home Financials are based on the most recent Mortgage that was taken out on this home.
Original Mortgage
$154,000
Outstanding Balance
$52,718
Interest Rate
8.43%
Mortgage Type
Purchase Money Mortgage
Estimated Equity
$342,380
Purchase Details
Closed on
May 29, 1997
Sold by
Kraner Shannon L and Kraner Abraham
Bought by
Maxwell Thomas V and Schab Stephen M
Home Financials for this Owner
Home Financials are based on the most recent Mortgage that was taken out on this home.
Original Mortgage
$138,000
Interest Rate
8.27%
Mortgage Type
Purchase Money Mortgage
Purchase Details
Closed on
Sep 6, 1988
Purchase Details
Closed on
Nov 1, 1984
Create a Home Valuation Report for This Property
The Home Valuation Report is an in-depth analysis detailing your home's value as well as a comparison with similar homes in the area
Home Values in the Area
Average Home Value in this Area
Purchase History
| Date | Buyer | Sale Price | Title Company |
|---|---|---|---|
| Dorsey Beth A | -- | None Available | |
| Dorsey Beth A | $192,500 | Hummel Title Agency Inc | |
| Maxwell Thomas V | $165,000 | -- | |
| -- | $142,000 | -- | |
| -- | $122,000 | -- |
Source: Public Records
Mortgage History
| Date | Status | Borrower | Loan Amount |
|---|---|---|---|
| Open | Dorsey Beth A | $154,000 | |
| Previous Owner | Maxwell Thomas V | $138,000 |
Source: Public Records
Tax History Compared to Growth
Tax History
| Year | Tax Paid | Tax Assessment Tax Assessment Total Assessment is a certain percentage of the fair market value that is determined by local assessors to be the total taxable value of land and additions on the property. | Land | Improvement |
|---|---|---|---|---|
| 2024 | $5,656 | $97,690 | $15,580 | $82,110 |
| 2023 | $5,585 | $97,685 | $15,575 | $82,110 |
| 2022 | $5,704 | $81,630 | $25,380 | $56,250 |
| 2021 | $5,049 | $81,630 | $25,380 | $56,250 |
| 2020 | $5,005 | $81,630 | $25,380 | $56,250 |
| 2019 | $4,920 | $70,950 | $22,050 | $48,900 |
| 2018 | $4,595 | $70,950 | $22,050 | $48,900 |
| 2017 | $4,582 | $70,950 | $22,050 | $48,900 |
| 2016 | $4,302 | $65,070 | $11,550 | $53,520 |
| 2015 | $4,299 | $65,070 | $11,550 | $53,520 |
| 2014 | $4,303 | $65,070 | $11,550 | $53,520 |
| 2013 | $2,055 | $59,150 | $10,500 | $48,650 |
Source: Public Records
Map
Nearby Homes
- 4781 Coach Rd
- 2165 Partlow Dr
- 2198 Sandston Rd
- 2060 Fontenay Place
- 4720 Merrifield Place Unit 67
- 2231 Atlee Ct Unit 12
- 4861 Etrick Dr Unit 22
- 1865 Willoway Cir N Unit 1865
- 1835 Willoway Cir N
- 4450 Haverford Ct
- 4924 Reed Rd Unit B
- 1961 Ramble Branch Dr Unit 30
- 5268 Captains Ct
- 2560 Chartwell Rd
- 1739 Paula Dr Unit 1739
- 1610 Lafayette Dr Unit 1610
- 1594 Lafayette Dr Unit 1594
- 2172 Hedgerow Rd Unit 2172G
- 5244 Greensedge Way Unit 12
- 5283 Ruthton Rd Unit 19
- 4778 Dierker Rd Unit 11
- 4770 Dierker Rd Unit 9
- 4782 Dierker Rd Unit 12
- 4786 Dierker Rd Unit 13
- 4774 Dierker Rd Unit 10
- 4766 Dierker Rd Unit 8
- 4798 Dierker Rd
- 4788 Dierker Rd Unit 14
- 4788 Dierker Rd Unit O
- 4796 Dierker Rd
- 4794 Dierker Rd
- 4792 Dierker Rd
- 4760 Dierker Rd Unit 7
- 4756 Dierker Rd
- 4747 Dierker Rd Unit 1
- 4775 Nugent Dr Unit 777
- 4750 Dierker Rd
- 4763 Nugent Dr Unit 765
- 4743 Dierker Rd Unit 3
- 4812 Dierker Rd