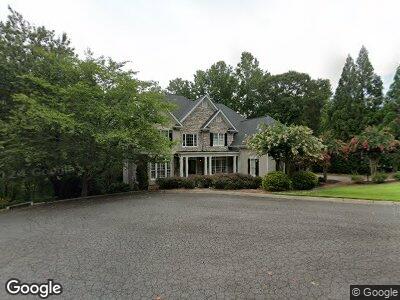
4789 Crest Park Ln Marietta, GA 30068
Estimated Value: $1,084,000 - $1,868,000
6
Beds
6
Baths
7,004
Sq Ft
$203/Sq Ft
Est. Value
About This Home
This home is located at 4789 Crest Park Ln, Marietta, GA 30068 and is currently estimated at $1,423,483, approximately $203 per square foot. 4789 Crest Park Ln is a home located in Cobb County with nearby schools including Timber Ridge Elementary School, Dickerson Middle School, and Walton High School.
Ownership History
Date
Name
Owned For
Owner Type
Purchase Details
Closed on
Aug 9, 2007
Sold by
Gittleman Lisa D
Bought by
Chartash Elliot and Kerrigan Patricia
Current Estimated Value
Home Financials for this Owner
Home Financials are based on the most recent Mortgage that was taken out on this home.
Original Mortgage
$380,000
Interest Rate
6.63%
Mortgage Type
New Conventional
Purchase Details
Closed on
Aug 25, 1997
Sold by
Redden Properties Inc
Bought by
Gittleman David
Home Financials for this Owner
Home Financials are based on the most recent Mortgage that was taken out on this home.
Original Mortgage
$528,000
Interest Rate
7.43%
Mortgage Type
New Conventional
Create a Home Valuation Report for This Property
The Home Valuation Report is an in-depth analysis detailing your home's value as well as a comparison with similar homes in the area
Home Values in the Area
Average Home Value in this Area
Purchase History
| Date | Buyer | Sale Price | Title Company |
|---|---|---|---|
| Chartash Elliot | $985,000 | -- | |
| Gittleman David | $660,000 | -- |
Source: Public Records
Mortgage History
| Date | Status | Borrower | Loan Amount |
|---|---|---|---|
| Open | Ashmore Sidney B | $100,000 | |
| Open | Ashmore Sidney B | $465,000 | |
| Closed | Ashmore Sidney B | $417,000 | |
| Closed | Chartash Elliott K | $356,000 | |
| Closed | Chartash Elliot K | $356,000 | |
| Closed | Chartash Elliot K | $365,000 | |
| Closed | Chartash Elliot | $380,000 | |
| Previous Owner | Gittleman Lisa D | $71,200 | |
| Previous Owner | Gittleman David | $100,000 | |
| Previous Owner | Gittleman Lisa D | $700,000 | |
| Previous Owner | Gittleman David | $528,000 |
Source: Public Records
Tax History Compared to Growth
Tax History
| Year | Tax Paid | Tax Assessment Tax Assessment Total Assessment is a certain percentage of the fair market value that is determined by local assessors to be the total taxable value of land and additions on the property. | Land | Improvement |
|---|---|---|---|---|
| 2024 | $4,381 | $477,376 | $112,000 | $365,376 |
| 2023 | $3,877 | $377,628 | $104,000 | $273,628 |
| 2022 | $4,083 | $377,628 | $104,000 | $273,628 |
| 2021 | $4,028 | $359,148 | $104,000 | $255,148 |
| 2020 | $10,900 | $359,148 | $104,000 | $255,148 |
| 2019 | $10,900 | $359,148 | $104,000 | $255,148 |
| 2018 | $10,900 | $359,148 | $104,000 | $255,148 |
| 2017 | $10,060 | $349,908 | $114,000 | $235,908 |
| 2016 | $10,060 | $349,908 | $114,000 | $235,908 |
| 2015 | $12,146 | $412,284 | $114,000 | $298,284 |
| 2014 | $9,160 | $308,300 | $0 | $0 |
Source: Public Records
Map
Nearby Homes
- 4794 Dalhousie Place NE
- 4765 Karls Gate Dr
- 4983 Odins Way
- 1824 Mallard Lake Dr
- 1850 Mallard Lake Dr
- 1670 Nordic Trace
- 4684 Roswell Rd NE
- 4580 Roswell Rd
- 1735 Little Willeo Rd
- 4799 Fairville Ct
- 1901 Shelburne Cove
- 1760 Little Willeo Rd
- 1720 Little Willeo Rd
- 5276 Weatherwood Trace
- 5073 Willow Point Pkwy
- 5238 Timber Ridge Rd
- 4710 Kinsmon Place
- 1380 Heritage Glen Dr
- 4789 Crest Park Ln
- 4787 Crest Park Ln
- 4791 Crest Park Ln
- 4785 Crest Park Ln
- 4851 Karls Gate Dr Unit 1
- 1615 Exeter Ct NE
- 4797 Old Timber Ridge Rd NE
- 4841 Karls Gate Dr Unit 1
- 4799 Old Timber Ridge Rd
- 4783 Crest Park Ln
- 4871 Karls Gate Dr
- 4797 Old Timber Ridge Rd
- 4795 Old Timber Ridge Rd NE
- 4795 Old Timber Ridge Rd
- 4801 Old Timber Ridge Rd Unit 1
- 4831 Karls Gate Dr Unit 1
- 1613 Exeter Ct NE Unit II
- 1614 Exeter Ct NE
- 0 Crest Park Ln
- 4881 Karls Gate Dr