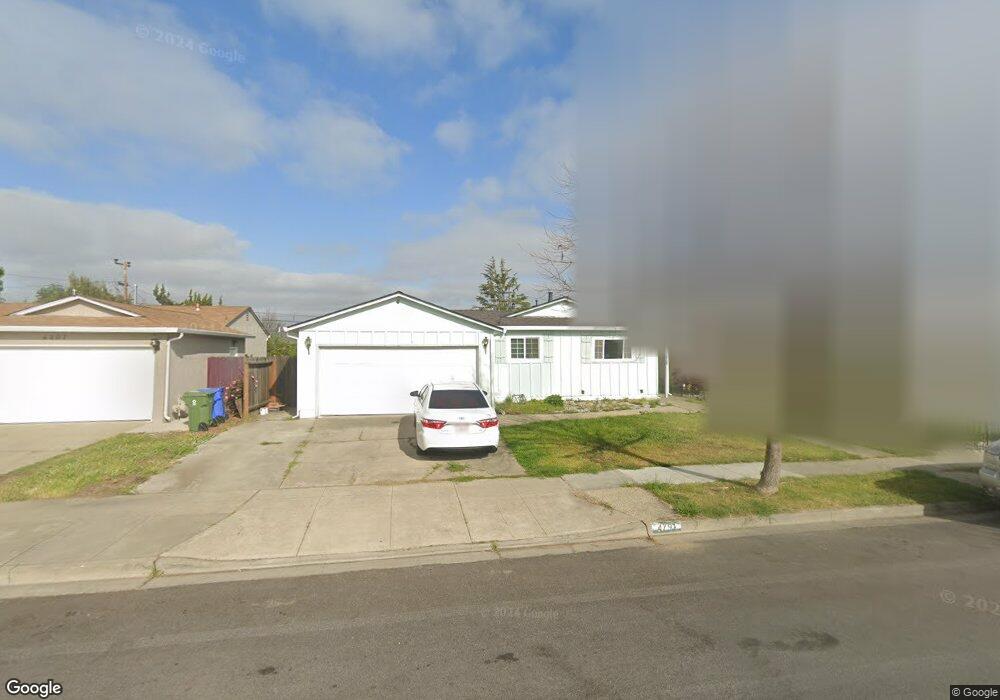
4791 Phelan Ave Fremont, CA 94538
Sundale NeighborhoodEstimated Value: $997,000 - $1,335,000
3
Beds
2
Baths
1,092
Sq Ft
$1,119/Sq Ft
Est. Value
About This Home
This home is located at 4791 Phelan Ave, Fremont, CA 94538 and is currently estimated at $1,222,118, approximately $1,119 per square foot. 4791 Phelan Ave is a home located in Alameda County with nearby schools including Joseph Azevada Elementary School, G.M. Walters Middle School, and John F. Kennedy High School.
Ownership History
Date
Name
Owned For
Owner Type
Purchase Details
Closed on
Mar 26, 2003
Sold by
Schneider John F and Schneider Nancy J
Bought by
Valencia Richard and Valencia Maria
Current Estimated Value
Home Financials for this Owner
Home Financials are based on the most recent Mortgage that was taken out on this home.
Original Mortgage
$316,000
Outstanding Balance
$136,150
Interest Rate
5.79%
Mortgage Type
Stand Alone First
Estimated Equity
$1,085,968
Purchase Details
Closed on
Sep 20, 2000
Sold by
Schneider John F and Schneider Nancy J
Bought by
Schneider John F and Schneider Nancy J
Home Financials for this Owner
Home Financials are based on the most recent Mortgage that was taken out on this home.
Original Mortgage
$248,500
Interest Rate
7.98%
Purchase Details
Closed on
May 6, 1998
Sold by
Roggasch Kirk A
Bought by
Schneider John F and Schneider Nancy J
Home Financials for this Owner
Home Financials are based on the most recent Mortgage that was taken out on this home.
Original Mortgage
$174,182
Interest Rate
7.13%
Mortgage Type
FHA
Purchase Details
Closed on
Oct 3, 1996
Sold by
Roggasch Lori A
Bought by
Roggasch Kirk Alan
Create a Home Valuation Report for This Property
The Home Valuation Report is an in-depth analysis detailing your home's value as well as a comparison with similar homes in the area
Home Values in the Area
Average Home Value in this Area
Purchase History
| Date | Buyer | Sale Price | Title Company |
|---|---|---|---|
| Valencia Richard | $434,500 | Chicago Title Co | |
| Schneider John F | -- | American Title Co | |
| Schneider John F | $196,000 | Old Republic Title Company | |
| Roggasch Kirk Alan | -- | -- |
Source: Public Records
Mortgage History
| Date | Status | Borrower | Loan Amount |
|---|---|---|---|
| Open | Valencia Richard | $316,000 | |
| Previous Owner | Schneider John F | $248,500 | |
| Previous Owner | Schneider John F | $174,182 | |
| Closed | Valencia Richard | $39,500 |
Source: Public Records
Tax History Compared to Growth
Tax History
| Year | Tax Paid | Tax Assessment Tax Assessment Total Assessment is a certain percentage of the fair market value that is determined by local assessors to be the total taxable value of land and additions on the property. | Land | Improvement |
|---|---|---|---|---|
| 2025 | $7,131 | $568,319 | $171,611 | $403,708 |
| 2024 | $7,131 | $557,041 | $168,247 | $395,794 |
| 2023 | $6,932 | $552,984 | $164,949 | $388,035 |
| 2022 | $6,831 | $535,143 | $161,715 | $380,428 |
| 2021 | $6,666 | $524,516 | $158,545 | $372,971 |
| 2020 | $6,615 | $523,070 | $156,921 | $366,149 |
| 2019 | $6,540 | $512,815 | $153,844 | $358,971 |
| 2018 | $6,411 | $502,763 | $150,829 | $351,934 |
| 2017 | $6,250 | $492,908 | $147,872 | $345,036 |
| 2016 | $6,137 | $483,246 | $144,974 | $338,272 |
| 2015 | $6,050 | $475,990 | $142,797 | $333,193 |
| 2014 | $5,941 | $466,668 | $140,000 | $326,668 |
Source: Public Records
Map
Nearby Homes
- 4714 Serra Ave
- 4692 Nelson St
- 39530 Dorrington Ct
- 5033 Blacksand Rd
- 4600 Nelson St
- 4737 Boone Dr
- 5330 Coco Palm Dr
- 39090 Presidio Way Unit 237
- 4715 Mildred Dr
- 5580 Hemlock Terrace
- 39753 Placer Way
- 40116 Crockett St
- 39751 Bissy Common
- 4840 Piper St
- 5624 Chestnut Common
- 4715 Eggers Dr
- 38976 Primula Terrace
- 38984 Primula Terrace
- 38837 Fremont Blvd
- 39134 Memorial St
- 4783 Phelan Ave
- 4807 Phelan Ave
- 4854 Murphy Ct
- 4884 Murphy Ct
- 4815 Phelan Ave
- 4775 Phelan Ave
- 4823 Phelan Ave
- 4796 Phelan Ave
- 39367 Sutter Dr
- 4834 Murphy Ct
- 4778 Phelan Ave
- 4810 Phelan Ave
- 39375 Sutter Dr
- 39359 Sutter Dr
- 4760 Phelan Ave
- 39383 Sutter Dr
- 39391 Sutter Dr
- 4818 Phelan Ave
- 4894 Murphy Ct
- 4831 Phelan Ave