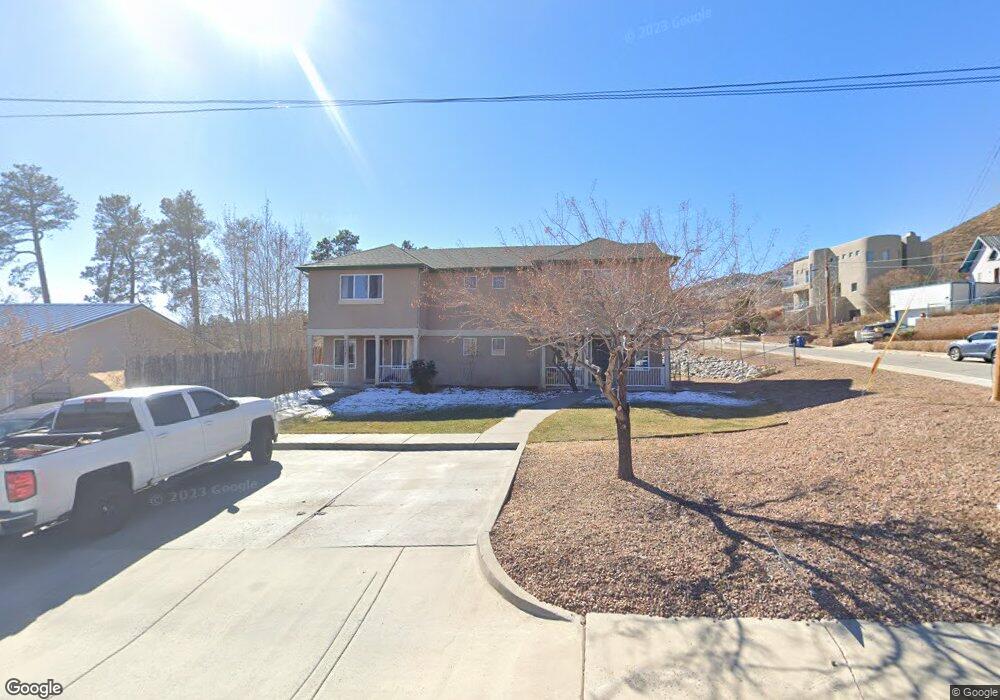
4791 Yucca St Los Alamos, NM 87544
Estimated Value: $638,000 - $945,000
3
Beds
3
Baths
1,746
Sq Ft
$434/Sq Ft
Est. Value
About This Home
This home is located at 4791 Yucca St, Los Alamos, NM 87544 and is currently estimated at $757,185, approximately $433 per square foot. 4791 Yucca St is a home located in Los Alamos County with nearby schools including Mountain Elementary School, Los Alamos Middle School, and Los Alamos High School.
Ownership History
Date
Name
Owned For
Owner Type
Purchase Details
Closed on
Apr 27, 2023
Sold by
Courtright Johnson Lynne
Bought by
Aalr Properties Llc
Current Estimated Value
Home Financials for this Owner
Home Financials are based on the most recent Mortgage that was taken out on this home.
Original Mortgage
$671,500
Outstanding Balance
$653,532
Interest Rate
6.6%
Mortgage Type
New Conventional
Estimated Equity
$103,653
Purchase Details
Closed on
Apr 19, 2023
Sold by
Courtright John
Bought by
Courtright Johnson Lynne
Home Financials for this Owner
Home Financials are based on the most recent Mortgage that was taken out on this home.
Original Mortgage
$671,500
Outstanding Balance
$653,532
Interest Rate
6.6%
Mortgage Type
New Conventional
Estimated Equity
$103,653
Purchase Details
Closed on
Nov 1, 2017
Sold by
J & L Self Storage & Vans Llc
Bought by
J & L Duplexes Llc
Create a Home Valuation Report for This Property
The Home Valuation Report is an in-depth analysis detailing your home's value as well as a comparison with similar homes in the area
Home Values in the Area
Average Home Value in this Area
Purchase History
| Date | Buyer | Sale Price | Title Company |
|---|---|---|---|
| Aalr Properties Llc | -- | None Listed On Document | |
| Yearout Logan | -- | None Listed On Document | |
| Courtright Johnson Lynne | -- | None Listed On Document | |
| Courtright John | -- | None Listed On Document | |
| Johnson Lynne Courtright | -- | None Listed On Document | |
| J & L Duplexes Llc | -- | None Available |
Source: Public Records
Mortgage History
| Date | Status | Borrower | Loan Amount |
|---|---|---|---|
| Open | Yearout Logan | $671,500 |
Source: Public Records
Tax History Compared to Growth
Tax History
| Year | Tax Paid | Tax Assessment Tax Assessment Total Assessment is a certain percentage of the fair market value that is determined by local assessors to be the total taxable value of land and additions on the property. | Land | Improvement |
|---|---|---|---|---|
| 2025 | $2,840 | $119,630 | $23,020 | $96,610 |
| 2024 | $2,737 | $116,150 | $22,530 | $93,620 |
| 2023 | $3,136 | $112,770 | $22,090 | $90,680 |
| 2022 | $3,064 | $126,830 | $23,660 | $103,170 |
| 2021 | $2,965 | $123,140 | $23,270 | $99,870 |
| 2020 | $2,933 | $119,550 | $22,920 | $96,630 |
| 2019 | $2,351 | $116,080 | $22,500 | $93,580 |
| 2018 | $2,827 | $112,690 | $22,080 | $90,610 |
| 2017 | $2,761 | $109,410 | $21,720 | $87,690 |
| 2016 | $2,589 | $106,230 | $21,650 | $84,580 |
| 2015 | $2,519 | $103,130 | $21,500 | $81,630 |
| 2014 | $2,292 | $101,480 | $21,500 | $79,980 |
| 2013 | $2,392 | $112,890 | $24,740 | $88,150 |
| 2011 | $2,294 | $106,460 | $25,510 | $80,950 |
Source: Public Records
Map
Nearby Homes
- 2356 45th St Unit A
- 4226 Alabama Ave
- 4131 Arkansas Ave Unit D
- 5385 Quemazon
- 3511 Arizona Ave
- 4714 Quemazon
- 4715 Quemazon
- 4780 Brisa Del Bosque
- 4039 Sycamore St
- 4039 Sycamore St Unit b
- 5020 Hermosura
- 2241 34th St
- 1650 Sereno
- 1620 Sonrisa
- 1511 43rd St Unit A and B
- 1459 46th St
- 3546 Questa Dr
- 3496 Questa Dr
- 3242 Walnut St Unit D
- 3483 Questa Dr