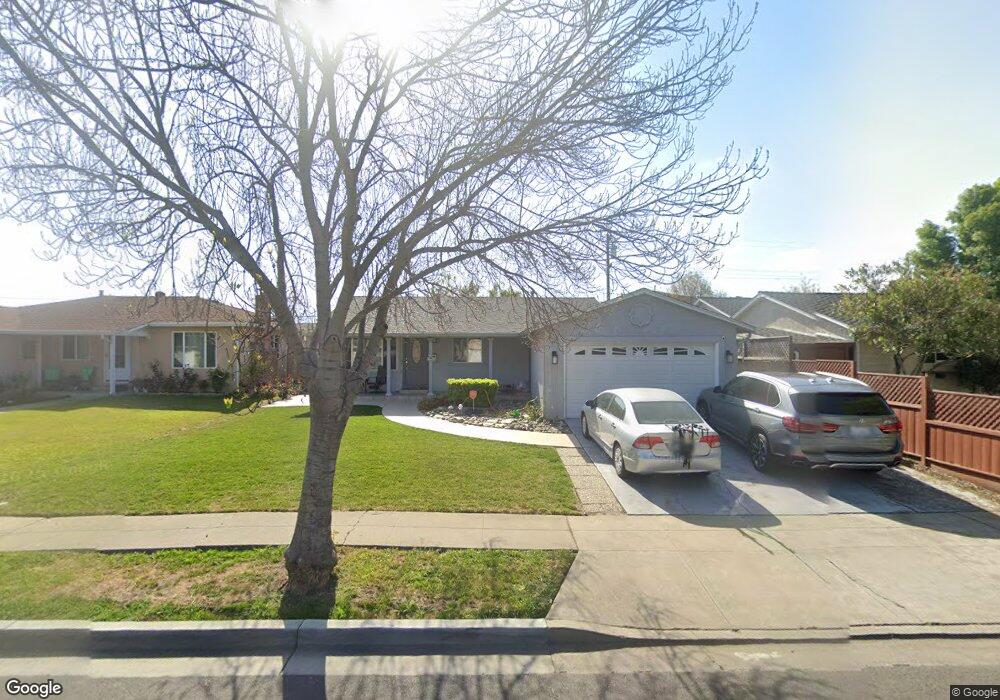
4796 Wheeler Dr Fremont, CA 94538
Sundale NeighborhoodEstimated Value: $1,102,000 - $1,361,000
3
Beds
2
Baths
1,300
Sq Ft
$986/Sq Ft
Est. Value
About This Home
This home is located at 4796 Wheeler Dr, Fremont, CA 94538 and is currently estimated at $1,281,462, approximately $985 per square foot. 4796 Wheeler Dr is a home located in Alameda County with nearby schools including Joseph Azevada Elementary School, G.M. Walters Middle School, and John F. Kennedy High School.
Ownership History
Date
Name
Owned For
Owner Type
Purchase Details
Closed on
Sep 26, 2016
Sold by
Burney Ali H and Burney Mehwish
Bought by
Burney Ali H
Current Estimated Value
Home Financials for this Owner
Home Financials are based on the most recent Mortgage that was taken out on this home.
Original Mortgage
$417,000
Outstanding Balance
$333,985
Interest Rate
3.43%
Mortgage Type
New Conventional
Estimated Equity
$947,477
Purchase Details
Closed on
Jul 21, 2008
Sold by
Flores Jamie and Flores Susan
Bought by
Burney Ali H
Home Financials for this Owner
Home Financials are based on the most recent Mortgage that was taken out on this home.
Original Mortgage
$489,321
Interest Rate
6.31%
Mortgage Type
FHA
Purchase Details
Closed on
Sep 11, 1995
Sold by
Dessouky Maged M and Dessouky Monica T
Bought by
Flores Jaime and Flores Susan
Home Financials for this Owner
Home Financials are based on the most recent Mortgage that was taken out on this home.
Original Mortgage
$156,750
Interest Rate
7.88%
Create a Home Valuation Report for This Property
The Home Valuation Report is an in-depth analysis detailing your home's value as well as a comparison with similar homes in the area
Home Values in the Area
Average Home Value in this Area
Purchase History
| Date | Buyer | Sale Price | Title Company |
|---|---|---|---|
| Burney Ali H | -- | Fidelity National Title | |
| Burney Ali H | $497,000 | Chicago Title Company | |
| Flores Jaime | $165,000 | Old Republic Title Company |
Source: Public Records
Mortgage History
| Date | Status | Borrower | Loan Amount |
|---|---|---|---|
| Open | Burney Ali H | $417,000 | |
| Closed | Burney Ali H | $489,321 | |
| Previous Owner | Flores Jaime | $156,750 |
Source: Public Records
Tax History Compared to Growth
Tax History
| Year | Tax Paid | Tax Assessment Tax Assessment Total Assessment is a certain percentage of the fair market value that is determined by local assessors to be the total taxable value of land and additions on the property. | Land | Improvement |
|---|---|---|---|---|
| 2025 | $8,418 | $701,671 | $191,991 | $509,680 |
| 2024 | $8,418 | $670,627 | $188,228 | $482,399 |
| 2023 | $7,712 | $615,126 | $184,538 | $430,588 |
| 2022 | $7,605 | $603,068 | $180,920 | $422,148 |
| 2021 | $7,421 | $591,245 | $177,373 | $413,872 |
| 2020 | $7,417 | $585,187 | $175,556 | $409,631 |
| 2019 | $7,335 | $573,716 | $172,115 | $401,601 |
| 2018 | $7,191 | $562,468 | $168,740 | $393,728 |
| 2017 | $7,013 | $551,440 | $165,432 | $386,008 |
| 2016 | $6,890 | $540,631 | $162,189 | $378,442 |
| 2015 | $6,796 | $532,514 | $159,754 | $372,760 |
| 2014 | $6,677 | $522,087 | $156,626 | $365,461 |
Source: Public Records
Map
Nearby Homes
- 4737 Boone Dr
- 39850 Sundale Dr
- 4600 Nelson St
- 4555 Stevenson Blvd
- 4840 Piper St
- 40116 Crockett St
- 5330 Coco Palm Dr
- 39530 Dorrington Ct
- 5580 Hemlock Terrace
- 40422 Landon Ave
- 5589 Roosevelt Place
- 4453 Porter St
- 5033 Blacksand Rd
- 4714 Serra Ave
- 4421 Cahill St
- 39993 Fremont Blvd Unit 102
- 39090 Presidio Way Unit 237
- 4751 Wadsworth Ct
- 3909 Stevenson Blvd Unit 402
- 40696 Robin St
- 4802 Wheeler Dr
- 4784 Wheeler Dr
- 4828 Wheeler Dr
- 4778 Wheeler Dr
- 4785 Boone Dr
- 4811 Boone Dr
- 4779 Boone Dr
- 4827 Boone Dr
- 4797 Wheeler Dr
- 4785 Wheeler Dr
- 4854 Wheeler Dr
- 4768 Wheeler Dr
- 4803 Wheeler Dr
- 4779 Wheeler Dr
- 4769 Boone Dr
- 4829 Wheeler Dr
- 4853 Boone Dr
- 4756 Wheeler Dr
- 4769 Wheeler Dr
- 4880 Wheeler Dr