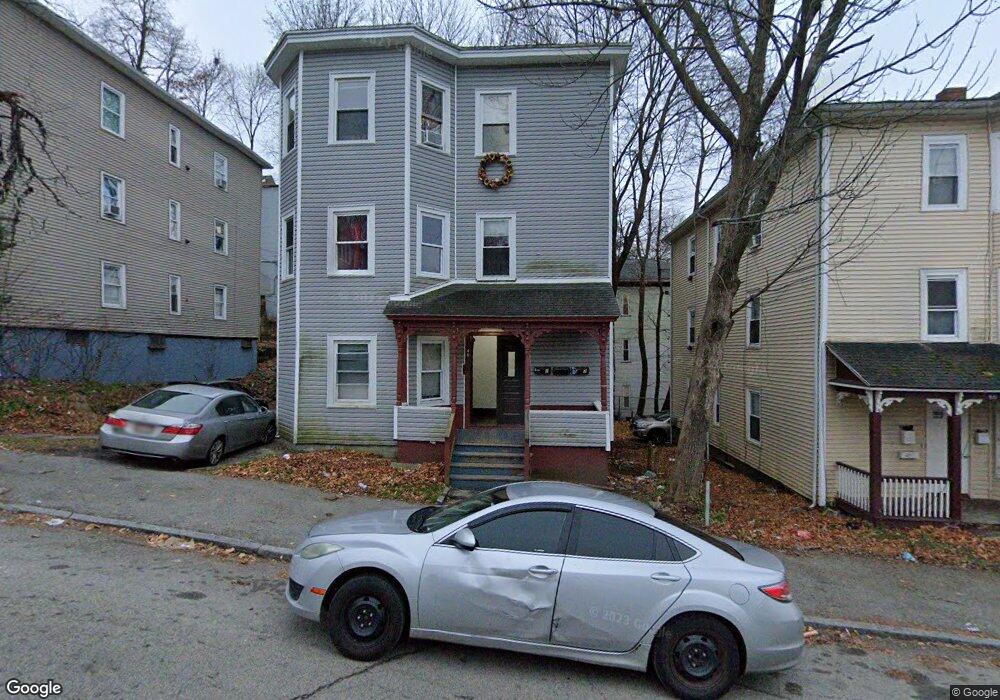
48 Catharine St Worcester, MA 01605
Bell Hill NeighborhoodEstimated Value: $608,000 - $653,000
6
Beds
3
Baths
2,534
Sq Ft
$247/Sq Ft
Est. Value
About This Home
This home is located at 48 Catharine St, Worcester, MA 01605 and is currently estimated at $624,667, approximately $246 per square foot. 48 Catharine St is a home located in Worcester County with nearby schools including Jacob Hiatt Magnet School, Chandler Magnet, and Worcester East Middle School.
Ownership History
Date
Name
Owned For
Owner Type
Purchase Details
Closed on
Nov 19, 2012
Sold by
Hsbc Bank Usa Na
Bought by
Tomaszewski Richard and Tomaszewski Elizabeth
Current Estimated Value
Purchase Details
Closed on
Jul 19, 2012
Sold by
Smith Charles K and Hsbc Bank Usa Na
Bought by
Hsbc Bank Usa Na
Purchase Details
Closed on
Aug 5, 2005
Sold by
Li Li Hua Hua and Xia Zhi Qiang
Bought by
Smith Charles K and Smith Hawa K
Home Financials for this Owner
Home Financials are based on the most recent Mortgage that was taken out on this home.
Original Mortgage
$205,600
Interest Rate
5.63%
Mortgage Type
Purchase Money Mortgage
Purchase Details
Closed on
Jan 21, 2004
Sold by
J A Rt
Bought by
Li Li Hua Hua and Xia Zhi Qiang
Home Financials for this Owner
Home Financials are based on the most recent Mortgage that was taken out on this home.
Original Mortgage
$183,600
Interest Rate
5.89%
Mortgage Type
Purchase Money Mortgage
Create a Home Valuation Report for This Property
The Home Valuation Report is an in-depth analysis detailing your home's value as well as a comparison with similar homes in the area
Home Values in the Area
Average Home Value in this Area
Purchase History
| Date | Buyer | Sale Price | Title Company |
|---|---|---|---|
| Tomaszewski Richard | $66,675 | -- | |
| Hsbc Bank Usa Na | $108,225 | -- | |
| Smith Charles K | $257,000 | -- | |
| Li Li Hua Hua | $216,500 | -- |
Source: Public Records
Mortgage History
| Date | Status | Borrower | Loan Amount |
|---|---|---|---|
| Previous Owner | Smith Charles K | $205,600 | |
| Previous Owner | Li Li Hua Hua | $183,600 |
Source: Public Records
Tax History Compared to Growth
Tax History
| Year | Tax Paid | Tax Assessment Tax Assessment Total Assessment is a certain percentage of the fair market value that is determined by local assessors to be the total taxable value of land and additions on the property. | Land | Improvement |
|---|---|---|---|---|
| 2025 | $6,470 | $490,500 | $65,700 | $424,800 |
| 2024 | $5,959 | $433,400 | $65,700 | $367,700 |
| 2023 | $5,719 | $398,800 | $57,200 | $341,600 |
| 2022 | $4,986 | $327,800 | $45,700 | $282,100 |
| 2021 | $4,314 | $265,000 | $36,600 | $228,400 |
| 2020 | $3,305 | $194,400 | $36,300 | $158,100 |
| 2019 | $3,292 | $182,900 | $31,700 | $151,200 |
| 2018 | $3,226 | $170,600 | $31,700 | $138,900 |
| 2017 | $3,035 | $157,900 | $31,700 | $126,200 |
| 2016 | $2,908 | $141,100 | $23,600 | $117,500 |
| 2015 | $2,276 | $113,400 | $23,600 | $89,800 |
| 2014 | $2,216 | $113,400 | $23,600 | $89,800 |
Source: Public Records
Map
Nearby Homes
- 145 Eastern Ave
- 40 Hooper St
- 24 Catharine St
- 10 Windsor St Unit C
- 12 Windsor St
- 19 Elizabeth St
- 17 Vinson St
- 119 Rodney St
- 67 Everard St
- 80 Stanton St Unit 14
- 80 Stanton St Unit 32
- 55 Channing St
- 44 Westminster St
- 126 Lincoln St
- 41 Westminster St
- 139 Lincoln St
- 26 Orne St
- 47 Laurel St
- 82 Green Hill Pkwy
- 78 Green Hill Pkwy
- 50 Catharine St
- 50 Catharine St Unit 1
- 46 Catharine St
- 30 Hooper St
- 30 Hooper St Unit 3
- 40-42 Hooper St
- 160 Eastern Ave
- 160 Eastern Ave Unit 3
- 28 Hooper St
- 158 Eastern Ave
- 156 Eastern Ave
- 51 Catharine St
- 26 Hooper St
- 26 Hooper St Unit 3
- 26 Hooper St Unit 2
- 49 Catharine St
- 49 Catharine St Unit 1
- 49 Catharine St Unit 2
- 49 Catharine St Unit 3
- 53 Catharine St