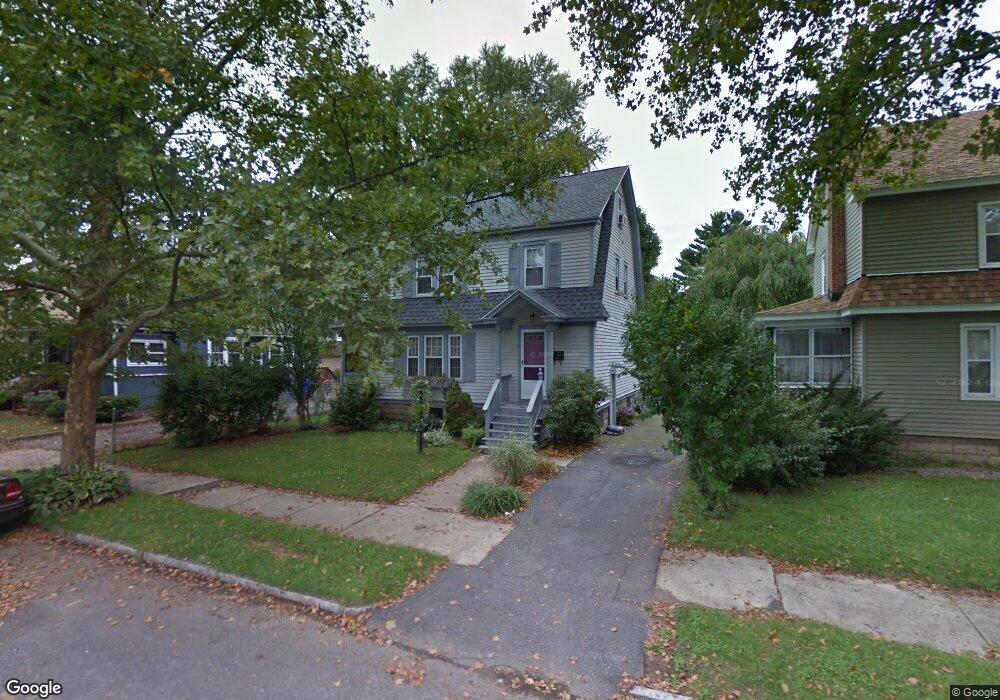
48 Chilson St Springfield, MA 01118
East Forest Park NeighborhoodEstimated Value: $276,178 - $308,000
3
Beds
2
Baths
1,475
Sq Ft
$199/Sq Ft
Est. Value
About This Home
This home is located at 48 Chilson St, Springfield, MA 01118 and is currently estimated at $293,795, approximately $199 per square foot. 48 Chilson St is a home located in Hampden County with nearby schools including Frederick Harris Elementary School, M Marcus Kiley Middle, and High School Of Commerce.
Ownership History
Date
Name
Owned For
Owner Type
Purchase Details
Closed on
Nov 3, 1995
Sold by
Chilson St Rt and Mathews Thomas A
Bought by
Victor Anthony and Victor Sharon
Current Estimated Value
Create a Home Valuation Report for This Property
The Home Valuation Report is an in-depth analysis detailing your home's value as well as a comparison with similar homes in the area
Home Values in the Area
Average Home Value in this Area
Purchase History
| Date | Buyer | Sale Price | Title Company |
|---|---|---|---|
| Victor Anthony | $35,000 | -- |
Source: Public Records
Mortgage History
| Date | Status | Borrower | Loan Amount |
|---|---|---|---|
| Open | Victor Anthony | $105,000 | |
| Closed | Victor Anthony | $60,000 | |
| Closed | Victor Anthony | $50,000 | |
| Closed | Victor Anthony | $35,000 |
Source: Public Records
Tax History
| Year | Tax Paid | Tax Assessment Tax Assessment Total Assessment is a certain percentage of the fair market value that is determined by local assessors to be the total taxable value of land and additions on the property. | Land | Improvement |
|---|---|---|---|---|
| 2025 | $3,680 | $234,700 | $36,800 | $197,900 |
| 2024 | $3,707 | $230,800 | $36,800 | $194,000 |
| 2023 | $3,361 | $197,100 | $35,100 | $162,000 |
| 2022 | $3,463 | $184,000 | $35,100 | $148,900 |
| 2021 | $3,270 | $173,000 | $31,900 | $141,100 |
| 2020 | $2,922 | $149,600 | $31,900 | $117,700 |
| 2019 | $2,936 | $149,200 | $31,900 | $117,300 |
| 2018 | $2,842 | $144,400 | $31,900 | $112,500 |
| 2017 | $2,631 | $133,800 | $30,500 | $103,300 |
| 2016 | $2,532 | $128,800 | $30,500 | $98,300 |
| 2015 | $2,455 | $124,800 | $30,500 | $94,300 |
Source: Public Records
Map
Nearby Homes
- 34 Castle St
- 161 Dorset St
- 77 Dorset St
- 13 Bither St
- 1088 Sumner Ave
- 88 Brunswick St
- 46 Eckington St
- 854-856 Sumner Ave
- 914-916 Belmont Ave
- 79 Roosevelt Ave
- 22 Eleanor Rd
- 59 Daviston St
- 134 Eddywood St
- 47 Hartford Terrace
- 33-35 Ruskin St
- 79 Arvilla St
- 38 Manchester Terrace
- 26 Dwight Rd
- 70-72 E Alvord St
- 170 Plumtree Rd
Your Personal Tour Guide
Ask me questions while you tour the home.