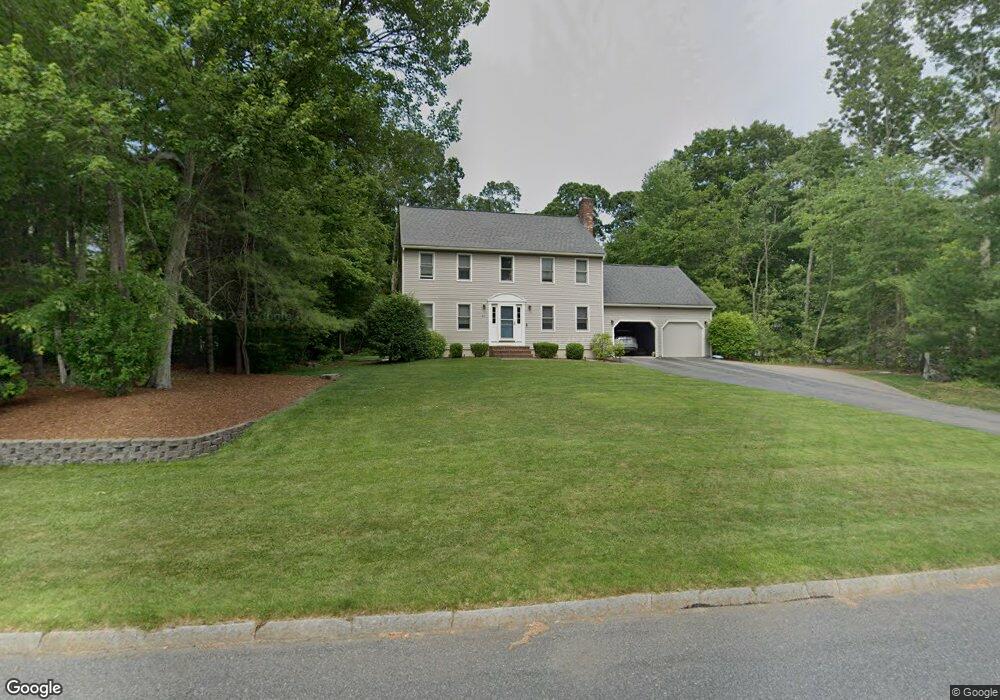
48 Deer Path Ln Mansfield, MA 02048
Estimated Value: $790,269 - $869,000
3
Beds
3
Baths
1,890
Sq Ft
$439/Sq Ft
Est. Value
About This Home
This home is located at 48 Deer Path Ln, Mansfield, MA 02048 and is currently estimated at $830,317, approximately $439 per square foot. 48 Deer Path Ln is a home located in Bristol County with nearby schools including Jordan/Jackson Elementary School, Everett W. Robinson Elementary School, and Harold L. Qualters Middle School.
Ownership History
Date
Name
Owned For
Owner Type
Purchase Details
Closed on
May 28, 2024
Sold by
Sorge Ft and Sorge
Bought by
Sorge Ft and Sorge
Current Estimated Value
Purchase Details
Closed on
Sep 27, 2010
Sold by
Sorge David A and Sorge Patricia E
Bought by
Sorge Tr David A and Sorge Patricia E
Home Financials for this Owner
Home Financials are based on the most recent Mortgage that was taken out on this home.
Original Mortgage
$130,000
Interest Rate
4.55%
Purchase Details
Closed on
Aug 24, 1992
Sold by
Christian & Feck Dev
Bought by
Sorge David A and Sorge Patricia E
Purchase Details
Closed on
Apr 24, 1992
Sold by
Walsh Patrick J and Walsh Eileen
Bought by
Christian & Jack Dev
Create a Home Valuation Report for This Property
The Home Valuation Report is an in-depth analysis detailing your home's value as well as a comparison with similar homes in the area
Home Values in the Area
Average Home Value in this Area
Purchase History
| Date | Buyer | Sale Price | Title Company |
|---|---|---|---|
| Sorge Ft | -- | None Available | |
| Sorge Ft | -- | None Available | |
| Sorge Tr David A | -- | -- | |
| Sorge David A | $179,000 | -- | |
| Christian & Jack Dev | $65,500 | -- | |
| Sorge Tr David A | -- | -- | |
| Sorge David A | $179,000 | -- | |
| Christian & Jack Dev | $65,500 | -- |
Source: Public Records
Mortgage History
| Date | Status | Borrower | Loan Amount |
|---|---|---|---|
| Previous Owner | Christian & Jack Dev | $130,000 | |
| Previous Owner | Christian & Jack Dev | $30,000 |
Source: Public Records
Tax History
| Year | Tax Paid | Tax Assessment Tax Assessment Total Assessment is a certain percentage of the fair market value that is determined by local assessors to be the total taxable value of land and additions on the property. | Land | Improvement |
|---|---|---|---|---|
| 2025 | $9,114 | $692,000 | $279,800 | $412,200 |
| 2024 | $9,010 | $667,400 | $291,900 | $375,500 |
| 2023 | $8,733 | $619,800 | $291,900 | $327,900 |
| 2022 | $8,403 | $553,900 | $270,200 | $283,700 |
| 2021 | $8,104 | $527,600 | $225,300 | $302,300 |
| 2020 | $7,981 | $519,600 | $225,300 | $294,300 |
| 2019 | $7,424 | $487,800 | $187,600 | $300,200 |
| 2018 | $7,376 | $473,700 | $178,900 | $294,800 |
| 2017 | $6,918 | $460,600 | $173,900 | $286,700 |
| 2016 | $6,636 | $430,600 | $165,500 | $265,100 |
| 2015 | $6,465 | $417,100 | $165,500 | $251,600 |
Source: Public Records
Map
Nearby Homes
- 1 Deer Path Ln
- 571 Ware St
- 460 Ware St
- 14 Windchime Dr
- 19 Barberry Rd
- 44 Fairfield Park Unit 44
- 46 Hope St
- 212 Mill St
- 28 Court St
- 266 N Main St Unit 3
- 81 Chilson Ave
- 21 Juniper Rd
- 150 Rumford Ave Unit 110
- 22 Pleasant St Unit C
- 0 Kensington Rd
- 268 Reservoir St
- 0 Cobb St
- 152 Central St
- 0 Brook Pkwy
- 4 Erick Rd Unit 90
- 52 Deer Path Ln
- 51 Deer Path Ln
- 2 Deer Path Cir
- 58 Deer Path Ln
- 55 Deer Path Ln
- 36 Deer Path Ln
- 39 Fieldstone Dr
- 5 Deer Path Cir
- 59 Deer Path Ln
- 62 Deer Path Ln
- 32 Deer Path Ln
- 6 Deer Path Cir
- 35 Fieldstone Dr
- 35 Deer Path Ln
- 63 Deer Path Ln
- 38 Fieldstone Dr
- 28 Deer Path Ln
- 31 Fieldstone Dr
- 9 Deer Path Cir
- 34 Fieldstone Dr
Your Personal Tour Guide
Ask me questions while you tour the home.