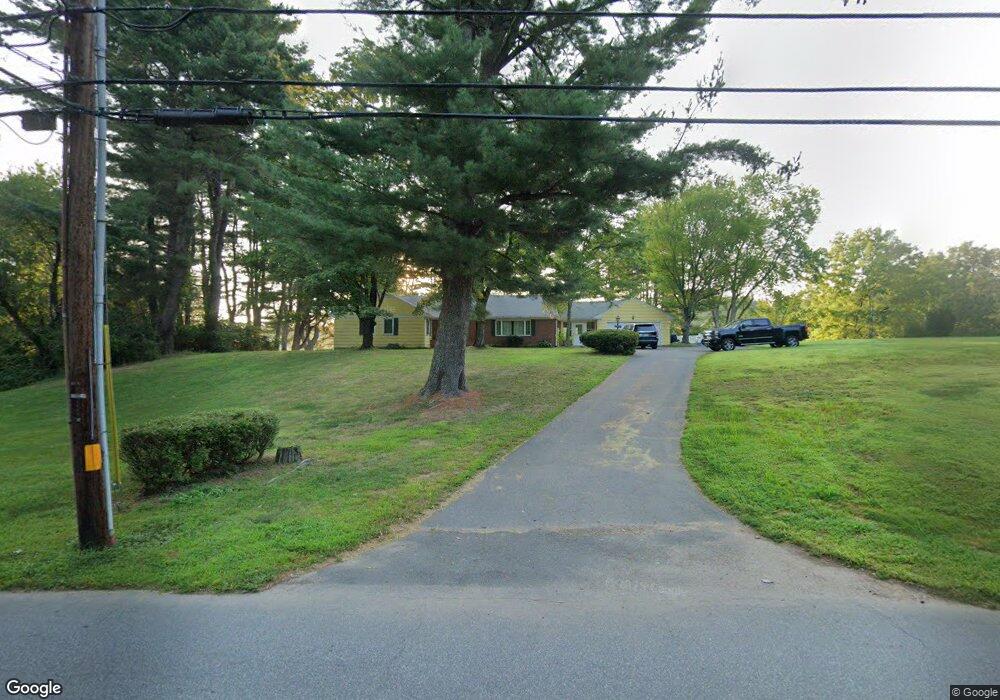
48 Duncaster Rd Bloomfield, CT 06002
Estimated Value: $491,034 - $531,000
3
Beds
3
Baths
1,870
Sq Ft
$278/Sq Ft
Est. Value
About This Home
This home is located at 48 Duncaster Rd, Bloomfield, CT 06002 and is currently estimated at $520,259, approximately $278 per square foot. 48 Duncaster Rd is a home located in Hartford County with nearby schools including Laurel School, Carmen Arace Intermediate School, and Metacomet School.
Ownership History
Date
Name
Owned For
Owner Type
Purchase Details
Closed on
Mar 13, 2023
Sold by
Kaczmarczyk Robert and Kaczmarczyk Kristine M
Bought by
Kaczmarczyk Robert and Kaczmarczyk Kristine M
Current Estimated Value
Purchase Details
Closed on
Nov 21, 2007
Sold by
R & J Construction Ent I
Bought by
Kaczmarczyk Robert and Johnson Kristine Marie
Purchase Details
Closed on
May 25, 2007
Sold by
R & J Constr Ent Inc
Bought by
Herson Victor and Herson Gail
Purchase Details
Closed on
Apr 27, 2007
Sold by
Lowe Richard and Lowe Jeanette
Bought by
R & J Construction
Purchase Details
Closed on
Oct 29, 1999
Sold by
Suburban Swim Raq Club
Bought by
Ghjcc Swim & Racquet Clb
Create a Home Valuation Report for This Property
The Home Valuation Report is an in-depth analysis detailing your home's value as well as a comparison with similar homes in the area
Home Values in the Area
Average Home Value in this Area
Purchase History
| Date | Buyer | Sale Price | Title Company |
|---|---|---|---|
| Kaczmarczyk Robert | -- | None Available | |
| Kaczmarczyk Robert | -- | None Available | |
| Kaczmarczyk Robert | $377,500 | -- | |
| Kaczmarczyk Robert | $377,500 | -- | |
| Herson Victor | $50,000 | -- | |
| Herson Victor | $50,000 | -- | |
| R & J Construction | $280,000 | -- | |
| R & J Construction | $280,000 | -- | |
| Ghjcc Swim & Racquet Clb | $168,500 | -- | |
| Ghjcc Swim & Racquet Clb | $168,500 | -- |
Source: Public Records
Mortgage History
| Date | Status | Borrower | Loan Amount |
|---|---|---|---|
| Previous Owner | Ghjcc Swim & Racquet Clb | $185,000 | |
| Previous Owner | Ghjcc Swim & Racquet Clb | $236,200 |
Source: Public Records
Tax History Compared to Growth
Tax History
| Year | Tax Paid | Tax Assessment Tax Assessment Total Assessment is a certain percentage of the fair market value that is determined by local assessors to be the total taxable value of land and additions on the property. | Land | Improvement |
|---|---|---|---|---|
| 2025 | $11,799 | $314,650 | $75,810 | $238,840 |
| 2024 | $8,147 | $207,620 | $65,800 | $141,820 |
| 2023 | $8,000 | $207,620 | $65,800 | $141,820 |
| 2022 | $7,423 | $206,010 | $64,190 | $141,820 |
| 2021 | $7,587 | $206,010 | $64,190 | $141,820 |
| 2020 | $7,470 | $206,010 | $64,190 | $141,820 |
| 2019 | $7,870 | $203,560 | $64,190 | $139,370 |
| 2018 | $7,553 | $195,580 | $64,330 | $131,250 |
| 2017 | $7,542 | $195,580 | $64,330 | $131,250 |
| 2016 | $7,364 | $195,580 | $64,330 | $131,250 |
| 2015 | $7,227 | $195,580 | $64,330 | $131,250 |
| 2014 | $7,088 | $198,310 | $65,520 | $132,790 |
Source: Public Records
Map
Nearby Homes
- 8 Roberts Rd
- 10 Butternut Dr
- 5 Butternut Dr
- 119 Wadhams Rd
- 10 Foothills Way
- 30 Vista Way
- 35 Saddle Ridge Unit 35
- 24 Alice Dr Unit 24
- 545 Simsbury Rd
- 2 Pent Rd
- 6 Wild Rose Ct Unit 6
- 23 Loeffler Rd
- 76 Silo Way Unit 76
- 9 Cobtail Way
- 18 Nolan Dr
- 9 Mallard Dr
- 40 Mountain Ave
- 70 Tunxis Ave
- 86 Gabb Rd
- 23 Hawthorne Ln Unit 23
- 50 Duncaster Rd
- 42 Duncaster Rd
- 49 Duncaster Rd
- 1 Stuart Dr
- 40 Duncaster Rd
- 52 Duncaster Rd
- 54 Duncaster Rd
- 39 Duncaster Rd
- 53 Duncaster Rd
- 38 Duncaster Rd
- 36 Duncaster Rd
- 56 Duncaster Rd
- 37 Duncaster Rd
- 2 Stone Hill Rd
- 35 Duncaster Rd
- 59 Duncaster Rd
- 6 Stuart Dr
- 5 Stone Hill Rd
- 3 Stone Hill Rd
- 33 Duncaster Rd