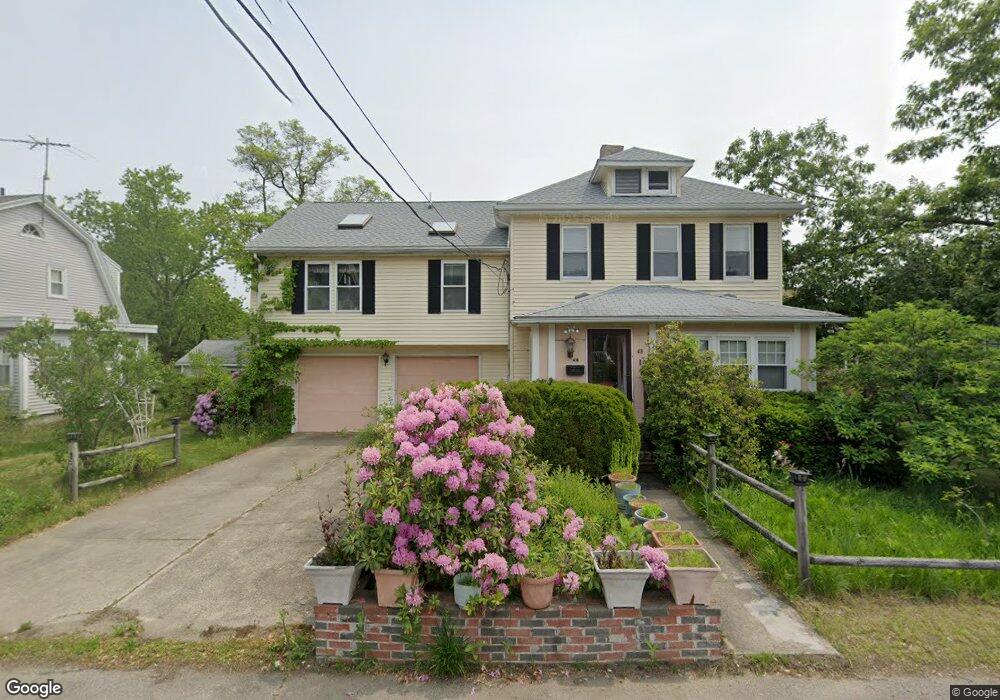
48 Grant Ave Brockton, MA 02301
Campello NeighborhoodEstimated Value: $509,723 - $571,000
5
Beds
2
Baths
1,968
Sq Ft
$272/Sq Ft
Est. Value
About This Home
This home is located at 48 Grant Ave, Brockton, MA 02301 and is currently estimated at $535,931, approximately $272 per square foot. 48 Grant Ave is a home located in Plymouth County with nearby schools including Gilmore Elementary School, Davis K-8 School, and John F. Kennedy Elementary School.
Ownership History
Date
Name
Owned For
Owner Type
Purchase Details
Closed on
Oct 30, 1998
Sold by
Dwyer William P and Dwyer Margaret R
Bought by
Dini Raymond M
Current Estimated Value
Home Financials for this Owner
Home Financials are based on the most recent Mortgage that was taken out on this home.
Original Mortgage
$116,900
Interest Rate
6.68%
Mortgage Type
Purchase Money Mortgage
Create a Home Valuation Report for This Property
The Home Valuation Report is an in-depth analysis detailing your home's value as well as a comparison with similar homes in the area
Home Values in the Area
Average Home Value in this Area
Purchase History
| Date | Buyer | Sale Price | Title Company |
|---|---|---|---|
| Dini Raymond M | $129,900 | -- |
Source: Public Records
Mortgage History
| Date | Status | Borrower | Loan Amount |
|---|---|---|---|
| Open | Dini Raymond M | $114,747 | |
| Closed | Dini Raymond M | $116,900 |
Source: Public Records
Tax History
| Year | Tax Paid | Tax Assessment Tax Assessment Total Assessment is a certain percentage of the fair market value that is determined by local assessors to be the total taxable value of land and additions on the property. | Land | Improvement |
|---|---|---|---|---|
| 2025 | $5,038 | $416,000 | $140,600 | $275,400 |
| 2024 | $4,834 | $402,200 | $140,600 | $261,600 |
| 2023 | $4,775 | $367,900 | $106,700 | $261,200 |
| 2022 | $4,549 | $325,600 | $97,000 | $228,600 |
| 2021 | $4,578 | $315,700 | $81,100 | $234,600 |
| 2020 | $4,084 | $269,600 | $75,500 | $194,100 |
| 2019 | $4,002 | $257,500 | $73,500 | $184,000 |
| 2018 | $3,895 | $242,500 | $73,500 | $169,000 |
| 2017 | $3,573 | $221,900 | $73,500 | $148,400 |
| 2016 | $3,128 | $180,200 | $71,400 | $108,800 |
| 2015 | $2,997 | $165,100 | $71,400 | $93,700 |
| 2014 | $2,984 | $164,600 | $71,400 | $93,200 |
Source: Public Records
Map
Nearby Homes
- 47 Southworth St
- 35 Longworth Ave Unit 25
- 115 Market St
- 25 Longworth Ave Unit 4
- 15 Longworth Ave Unit 226
- 326 Copeland St
- 9 Longworth Ave Unit 135
- 9 Longworth Ave Unit 113
- 34 South St
- 15 Market St
- 26 South St
- 60 Tremont St
- 65 Tremont St
- 25 Tremont St
- 23 E Chestnut St
- 24 E Chestnut St
- 223 Clinton St Unit 16
- 82 Carroll Ave
- 936 Warren Ave
- 127 Hillberg Ave
Your Personal Tour Guide
Ask me questions while you tour the home.