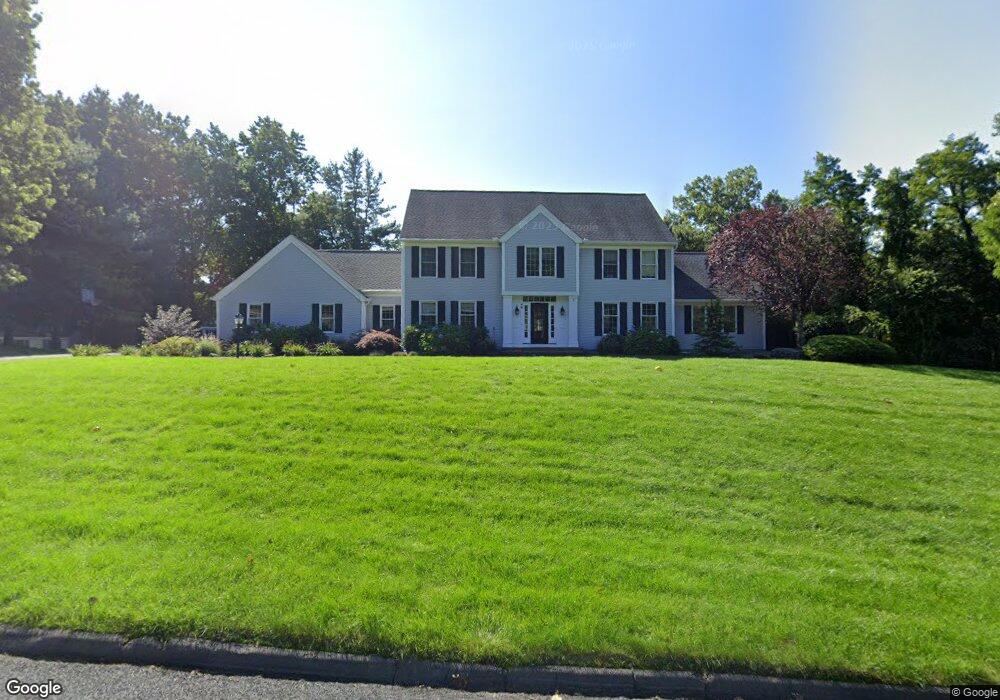
48 Juniper Hill Somers, CT 06071
Estimated Value: $685,028 - $735,000
5
Beds
4
Baths
3,258
Sq Ft
$218/Sq Ft
Est. Value
About This Home
This home is located at 48 Juniper Hill, Somers, CT 06071 and is currently estimated at $709,009, approximately $217 per square foot. 48 Juniper Hill is a home located in Tolland County with nearby schools including Somers Elementary School, Mabelle B. Avery Middle School, and Somers High School.
Ownership History
Date
Name
Owned For
Owner Type
Purchase Details
Closed on
Mar 16, 2012
Sold by
Bridge John L and Bridge Mary E
Bought by
Radziewicz Joseph C and Radziewicz Kimberly M
Current Estimated Value
Home Financials for this Owner
Home Financials are based on the most recent Mortgage that was taken out on this home.
Original Mortgage
$355,280
Outstanding Balance
$243,936
Interest Rate
3.86%
Estimated Equity
$465,073
Purchase Details
Closed on
Jul 12, 1995
Sold by
Richard Mccullough Inc
Bought by
Bridge John and Bridge Mary Ellen
Create a Home Valuation Report for This Property
The Home Valuation Report is an in-depth analysis detailing your home's value as well as a comparison with similar homes in the area
Home Values in the Area
Average Home Value in this Area
Purchase History
| Date | Buyer | Sale Price | Title Company |
|---|---|---|---|
| Radziewicz Joseph C | $445,000 | -- | |
| Radziewicz Joseph C | $445,000 | -- | |
| Bridge John | $60,000 | -- | |
| Bridge John | $60,000 | -- |
Source: Public Records
Mortgage History
| Date | Status | Borrower | Loan Amount |
|---|---|---|---|
| Open | Bridge John | $355,280 | |
| Closed | Bridge John | $40,000 | |
| Closed | Bridge John | $355,280 | |
| Previous Owner | Bridge John | $280,000 |
Source: Public Records
Tax History Compared to Growth
Tax History
| Year | Tax Paid | Tax Assessment Tax Assessment Total Assessment is a certain percentage of the fair market value that is determined by local assessors to be the total taxable value of land and additions on the property. | Land | Improvement |
|---|---|---|---|---|
| 2025 | $9,410 | $311,500 | $78,600 | $232,900 |
| 2024 | $9,021 | $311,500 | $78,600 | $232,900 |
| 2023 | $8,819 | $311,500 | $78,600 | $232,900 |
| 2022 | $8,585 | $311,500 | $78,600 | $232,900 |
| 2021 | $8,305 | $311,500 | $78,600 | $232,900 |
| 2020 | $8,310 | $303,600 | $78,600 | $225,000 |
| 2019 | $8,386 | $306,400 | $86,900 | $219,500 |
| 2018 | $8,386 | $306,400 | $86,900 | $219,500 |
| 2017 | $7,804 | $306,400 | $86,900 | $219,500 |
| 2016 | $7,421 | $306,400 | $86,900 | $219,500 |
| 2015 | $7,177 | $307,100 | $91,400 | $215,700 |
| 2014 | $7,177 | $307,100 | $91,400 | $215,700 |
Source: Public Records
Map
Nearby Homes