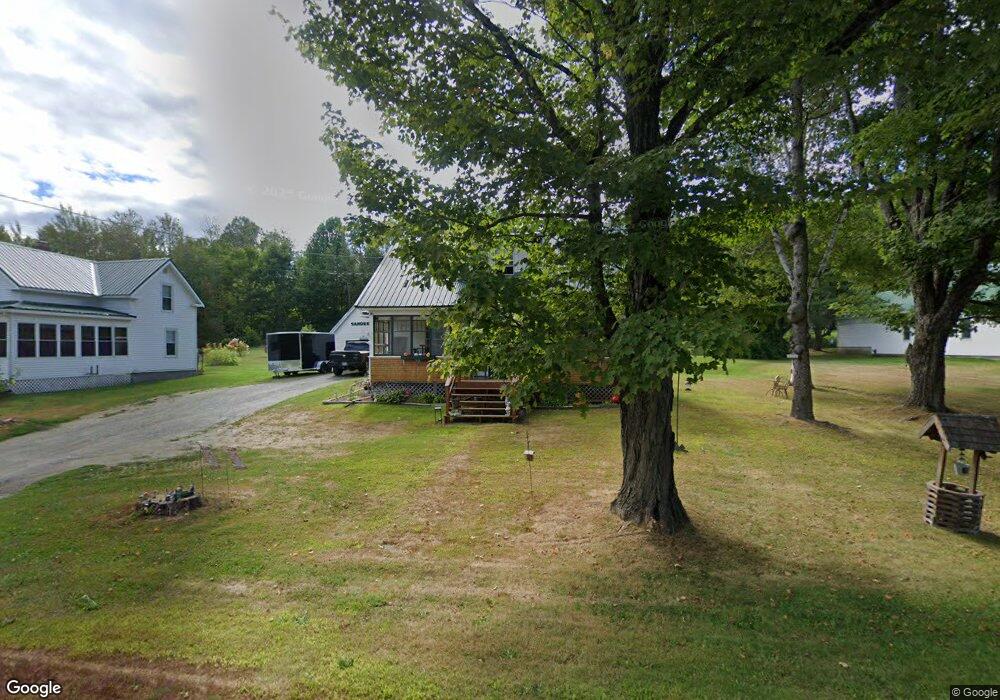
48 Main St Sangerville, ME 04479
Estimated Value: $178,000 - $248,000
2
Beds
2
Baths
1,172
Sq Ft
$179/Sq Ft
Est. Value
About This Home
This home is located at 48 Main St, Sangerville, ME 04479 and is currently estimated at $209,908, approximately $179 per square foot. 48 Main St is a home located in Piscataquis County with nearby schools including Piscataquis Community Elementary School and Piscataquis Community Secondary School.
Ownership History
Date
Name
Owned For
Owner Type
Purchase Details
Closed on
Sep 8, 2006
Sold by
Grant Ruthann and Gerry Sandra
Bought by
Grant Kristie L and Gagnon Nicholas P
Current Estimated Value
Home Financials for this Owner
Home Financials are based on the most recent Mortgage that was taken out on this home.
Original Mortgage
$53,160
Interest Rate
7%
Mortgage Type
Adjustable Rate Mortgage/ARM
Create a Home Valuation Report for This Property
The Home Valuation Report is an in-depth analysis detailing your home's value as well as a comparison with similar homes in the area
Home Values in the Area
Average Home Value in this Area
Purchase History
| Date | Buyer | Sale Price | Title Company |
|---|---|---|---|
| Grant Kristie L | -- | -- |
Source: Public Records
Mortgage History
| Date | Status | Borrower | Loan Amount |
|---|---|---|---|
| Closed | Grant Kristie L | $53,160 |
Source: Public Records
Tax History Compared to Growth
Tax History
| Year | Tax Paid | Tax Assessment Tax Assessment Total Assessment is a certain percentage of the fair market value that is determined by local assessors to be the total taxable value of land and additions on the property. | Land | Improvement |
|---|---|---|---|---|
| 2024 | $1,359 | $114,480 | $24,000 | $90,480 |
| 2023 | $1,253 | $67,940 | $16,000 | $51,940 |
| 2022 | $1,083 | $67,940 | $16,000 | $51,940 |
| 2021 | $1,131 | $67,940 | $16,000 | $51,940 |
| 2020 | $1,144 | $67,940 | $16,000 | $51,940 |
| 2019 | $1,250 | $67,940 | $16,000 | $51,940 |
| 2018 | $1,260 | $67,940 | $16,000 | $51,940 |
| 2017 | $1,291 | $67,940 | $16,000 | $51,940 |
| 2016 | $1,291 | $67,940 | $16,000 | $51,940 |
| 2015 | $1,190 | $64,320 | $16,000 | $48,320 |
| 2014 | $1,138 | $64,320 | $16,000 | $48,320 |
Source: Public Records
Map
Nearby Homes