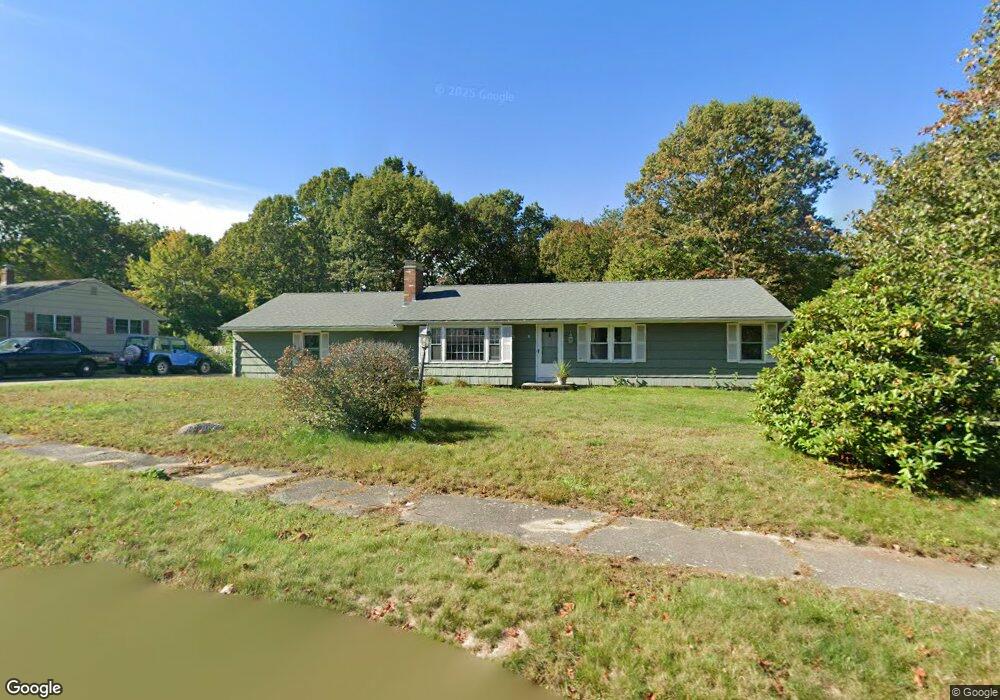
48 Mark Bradford Dr Holden, MA 01520
Estimated Value: $501,000 - $550,000
3
Beds
1
Bath
1,724
Sq Ft
$309/Sq Ft
Est. Value
About This Home
This home is located at 48 Mark Bradford Dr, Holden, MA 01520 and is currently estimated at $532,006, approximately $308 per square foot. 48 Mark Bradford Dr is a home located in Worcester County with nearby schools including Wachusett Regional High School, Abby Kelley Foster Charter Public School, and Bancroft School.
Ownership History
Date
Name
Owned For
Owner Type
Purchase Details
Closed on
May 15, 2006
Sold by
Scichilone Marie
Bought by
Willoughby Donald C and Willoughby James E
Current Estimated Value
Home Financials for this Owner
Home Financials are based on the most recent Mortgage that was taken out on this home.
Original Mortgage
$243,200
Outstanding Balance
$140,851
Interest Rate
6.4%
Mortgage Type
Purchase Money Mortgage
Estimated Equity
$391,155
Purchase Details
Closed on
Feb 15, 2001
Sold by
Lee Timothy G and Lee Anne M
Bought by
Schchilone Marie
Home Financials for this Owner
Home Financials are based on the most recent Mortgage that was taken out on this home.
Original Mortgage
$133,000
Interest Rate
7.08%
Mortgage Type
Purchase Money Mortgage
Purchase Details
Closed on
Apr 30, 1996
Sold by
Tella Louis L and Tella Linda
Bought by
Lee Timothy G and Lee Anne M
Home Financials for this Owner
Home Financials are based on the most recent Mortgage that was taken out on this home.
Original Mortgage
$133,000
Interest Rate
7.81%
Mortgage Type
Purchase Money Mortgage
Create a Home Valuation Report for This Property
The Home Valuation Report is an in-depth analysis detailing your home's value as well as a comparison with similar homes in the area
Home Values in the Area
Average Home Value in this Area
Purchase History
| Date | Buyer | Sale Price | Title Company |
|---|---|---|---|
| Willoughby Donald C | $304,000 | -- | |
| Schchilone Marie | $193,000 | -- | |
| Lee Timothy G | $140,000 | -- |
Source: Public Records
Mortgage History
| Date | Status | Borrower | Loan Amount |
|---|---|---|---|
| Open | Willoughby Donald C | $243,200 | |
| Previous Owner | Lee Timothy G | $135,000 | |
| Previous Owner | Lee Timothy G | $133,000 | |
| Previous Owner | Lee Timothy G | $133,000 | |
| Previous Owner | Lee Timothy G | $133,000 |
Source: Public Records
Tax History Compared to Growth
Tax History
| Year | Tax Paid | Tax Assessment Tax Assessment Total Assessment is a certain percentage of the fair market value that is determined by local assessors to be the total taxable value of land and additions on the property. | Land | Improvement |
|---|---|---|---|---|
| 2025 | $6,003 | $433,100 | $183,500 | $249,600 |
| 2024 | $5,741 | $405,700 | $178,200 | $227,500 |
| 2023 | $5,534 | $369,200 | $154,900 | $214,300 |
| 2022 | $5,332 | $322,000 | $120,900 | $201,100 |
| 2021 | $5,182 | $297,800 | $115,200 | $182,600 |
| 2020 | $4,791 | $281,800 | $109,700 | $172,100 |
| 2019 | $4,732 | $271,200 | $109,700 | $161,500 |
| 2018 | $4,609 | $261,700 | $104,400 | $157,300 |
| 2017 | $4,505 | $256,100 | $104,400 | $151,700 |
| 2016 | $4,392 | $254,600 | $99,400 | $155,200 |
| 2015 | $4,396 | $242,600 | $99,400 | $143,200 |
| 2014 | $4,306 | $242,600 | $99,400 | $143,200 |
Source: Public Records
Map
Nearby Homes
- 47 Preservation Ln
- 15 Lowell Ave
- 622 Shrewsbury St
- 83 Stoneleigh Rd
- 93 Winfield Rd
- 206 Wachusett St
- 36 Wilde Willow Dr
- 47 Chapel St
- 250 Shrewsbury St
- 160 Shrewsbury St
- 9 Birchwood Dr
- 39 Davidson Rd
- 44 Dixfield St
- 55 Meola Ave
- 122 Holden St
- 20 Hawthorne Dr
- 39 Meola Ave
- 26 Danielles Way
- 22 Danielles Way
- 33 Meola Ave
- 56 Mark Bradford Dr
- 119 Mark Bradford Dr
- 36 Mark Bradford Dr
- 45 Mark Bradford Dr
- 113 Mark Bradford Dr
- 39 Mark Bradford Dr
- 51 Mark Bradford Dr
- 116 Mark Bradford Dr
- 66 Mark Bradford Dr
- 28 Mark Bradford Dr
- 59 Mark Bradford Dr
- 33 Mark Bradford Dr
- 204 Bullard St
- 65 Mark Bradford Dr
- 198 Bullard St
- lot 3 Malden St
- 212 Bullard St
- 27 Mark Bradford Dr
- 80 Mark Bradford Dr
- 100 Mark Bradford Dr