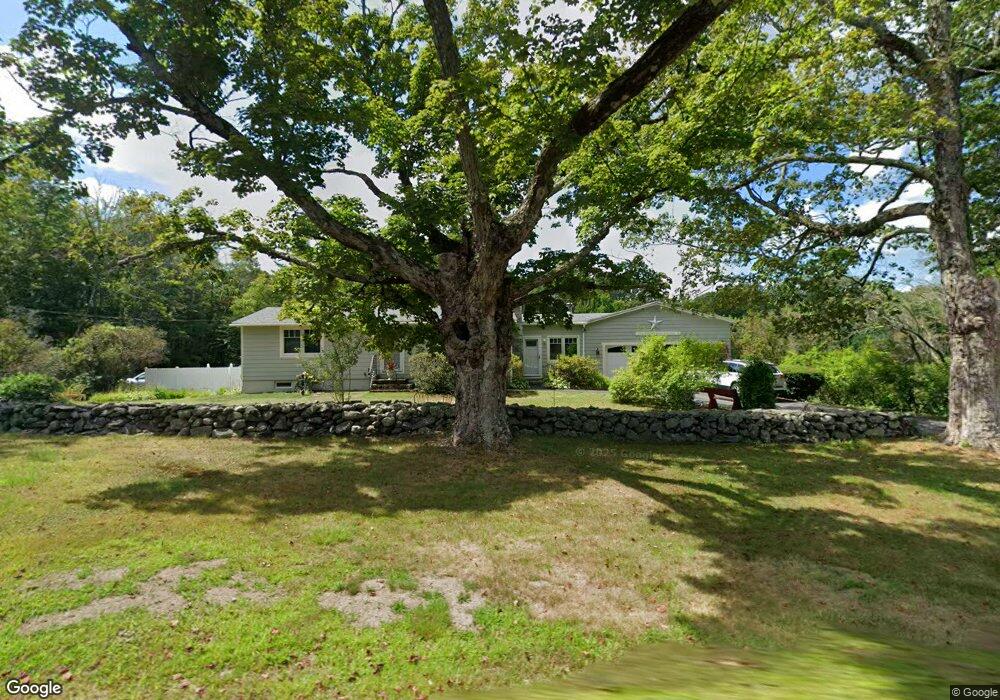
48 S Main St New Salem, MA 01355
New Salem NeighborhoodEstimated Value: $368,000 - $444,000
2
Beds
1
Bath
1,156
Sq Ft
$342/Sq Ft
Est. Value
About This Home
This home is located at 48 S Main St, New Salem, MA 01355 and is currently estimated at $395,773, approximately $342 per square foot. 48 S Main St is a home located in Franklin County with nearby schools including Swift River School and Ralph C Mahar Regional School.
Ownership History
Date
Name
Owned For
Owner Type
Purchase Details
Closed on
Jun 7, 2016
Sold by
Wetherby Brian C
Bought by
Wetherby Brian C and Wetherby Diane E
Current Estimated Value
Purchase Details
Closed on
Dec 12, 2003
Sold by
Wetherby Brian C and Wetherby Karen M
Bought by
Wetherby Brian C
Home Financials for this Owner
Home Financials are based on the most recent Mortgage that was taken out on this home.
Original Mortgage
$116,000
Interest Rate
5.9%
Mortgage Type
Purchase Money Mortgage
Purchase Details
Closed on
May 2, 1986
Bought by
Wetherby Brian C
Create a Home Valuation Report for This Property
The Home Valuation Report is an in-depth analysis detailing your home's value as well as a comparison with similar homes in the area
Home Values in the Area
Average Home Value in this Area
Purchase History
| Date | Buyer | Sale Price | Title Company |
|---|---|---|---|
| Wetherby Brian C | -- | -- | |
| Wetherby Brian C | -- | -- | |
| Wetherby Brian C | -- | -- |
Source: Public Records
Mortgage History
| Date | Status | Borrower | Loan Amount |
|---|---|---|---|
| Previous Owner | Wetherby Brian C | $100,000 | |
| Previous Owner | Wetherby Brian C | $116,000 | |
| Previous Owner | Wetherby Brian C | $25,000 | |
| Previous Owner | Wetherby Brian C | $71,000 |
Source: Public Records
Tax History Compared to Growth
Tax History
| Year | Tax Paid | Tax Assessment Tax Assessment Total Assessment is a certain percentage of the fair market value that is determined by local assessors to be the total taxable value of land and additions on the property. | Land | Improvement |
|---|---|---|---|---|
| 2025 | $4,389 | $323,200 | $52,200 | $271,000 |
| 2024 | $3,617 | $251,700 | $68,000 | $183,700 |
| 2023 | $3,765 | $245,300 | $61,600 | $183,700 |
| 2022 | $4,030 | $213,000 | $61,600 | $151,400 |
| 2021 | $3,820 | $194,600 | $56,100 | $138,500 |
| 2020 | $3,511 | $194,600 | $56,100 | $138,500 |
| 2019 | $3,419 | $194,600 | $56,100 | $138,500 |
| 2018 | $3,392 | $187,100 | $54,300 | $132,800 |
| 2017 | $3,208 | $178,900 | $51,800 | $127,100 |
| 2016 | $3,082 | $178,900 | $51,800 | $127,100 |
| 2015 | $3,062 | $185,800 | $54,100 | $131,700 |
Source: Public Records
Map
Nearby Homes
- 72 N Main St
- 0 Wendell Rd
- Lot 55 Wendell Rd
- 63 Cooleyville Rd
- 0 Cooleyville Rd
- 2 Fay Rd
- Back Lot 0 Petersham Rd
- Lot 31 Wendell Rd
- 0 S Main St
- 28 Morse Village Rd
- 120 Horton Rd
- 610 S Main St
- 270 Holtshire Rd
- 4 West St
- 0 Shore Dr
- 84 Lake Dr
- 85 Lake Dr
- 248 Holtshire Rd Unit Lot 2
- 36 Merrill Dr
- 133 Lakeview Rd