Estimated Value: $671,000 - $969,000
3
Beds
2
Baths
1,364
Sq Ft
$551/Sq Ft
Est. Value
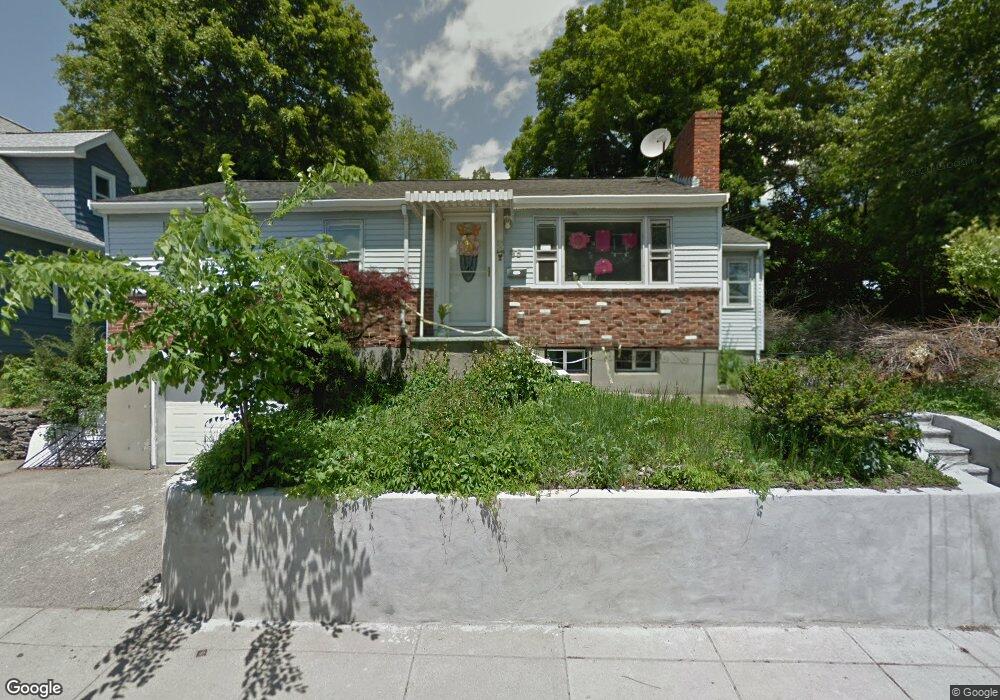
About This Home
This home is located at 48 Spring Rd, West Roxbury, MA 02132 and is currently estimated at $751,723, approximately $551 per square foot. 48 Spring Rd is a home located in Suffolk County with nearby schools including St Theresa School and Catholic Memorial School.
Ownership History
Date
Name
Owned For
Owner Type
Purchase Details
Closed on
Nov 28, 2018
Sold by
Kilduff Robert T and Harris Robin M
Bought by
Kilduff Robert T
Current Estimated Value
Home Financials for this Owner
Home Financials are based on the most recent Mortgage that was taken out on this home.
Original Mortgage
$395,000
Outstanding Balance
$346,640
Interest Rate
4.8%
Mortgage Type
VA
Estimated Equity
$405,083
Purchase Details
Closed on
Mar 3, 2009
Sold by
Kilduff Robert T
Bought by
Kilduff Robert T and Kilduff Robin M
Purchase Details
Closed on
Sep 17, 2004
Sold by
Turley Laura B and Turley Stephen C
Bought by
Kilduff Robert T
Home Financials for this Owner
Home Financials are based on the most recent Mortgage that was taken out on this home.
Original Mortgage
$292,000
Interest Rate
6.02%
Mortgage Type
Purchase Money Mortgage
Purchase Details
Closed on
Oct 26, 2000
Sold by
Jordan Philip A and Ring Susan F
Bought by
Turley Stephen C and Turley Laura B
Purchase Details
Closed on
Aug 11, 1988
Sold by
Boyd Carol A
Bought by
Jordan Philip A
Create a Home Valuation Report for This Property
The Home Valuation Report is an in-depth analysis detailing your home's value as well as a comparison with similar homes in the area
Home Values in the Area
Average Home Value in this Area
Purchase History
| Date | Buyer | Sale Price | Title Company |
|---|---|---|---|
| Kilduff Robert T | -- | -- | |
| Kilduff Robert T | -- | -- | |
| Kilduff Robert T | $365,000 | -- | |
| Turley Stephen C | $230,000 | -- | |
| Jordan Philip A | $156,800 | -- |
Source: Public Records
Mortgage History
| Date | Status | Borrower | Loan Amount |
|---|---|---|---|
| Open | Kilduff Robert T | $395,000 | |
| Previous Owner | Jordan Philip A | $292,000 | |
| Previous Owner | Jordan Philip A | $73,000 |
Source: Public Records
Tax History Compared to Growth
Tax History
| Year | Tax Paid | Tax Assessment Tax Assessment Total Assessment is a certain percentage of the fair market value that is determined by local assessors to be the total taxable value of land and additions on the property. | Land | Improvement |
|---|---|---|---|---|
| 2025 | $6,148 | $530,900 | $208,900 | $322,000 |
| 2024 | $5,310 | $487,200 | $164,500 | $322,700 |
| 2023 | $5,233 | $487,200 | $164,500 | $322,700 |
| 2022 | $4,909 | $451,200 | $152,400 | $298,800 |
| 2021 | $4,468 | $418,700 | $145,100 | $273,600 |
| 2020 | $4,322 | $409,300 | $122,700 | $286,600 |
| 2019 | $4,177 | $396,300 | $113,200 | $283,100 |
| 2018 | $4,033 | $384,800 | $113,200 | $271,600 |
| 2017 | $4,075 | $384,800 | $113,200 | $271,600 |
| 2016 | $4,133 | $375,700 | $113,900 | $261,800 |
| 2015 | $3,944 | $325,700 | $133,900 | $191,800 |
| 2014 | $3,902 | $310,200 | $133,900 | $176,300 |
Source: Public Records
Map
Nearby Homes
- 5245 Washington St Unit 5
- 11 Cheriton Rd Unit 102B
- 150 Grove St
- 25R Rockland St Unit 6
- 199 Glenellen Rd
- 115 Grove St Unit 11
- 111 Grove St Unit 6
- 191 Glenellen Rd
- 55 Cottage Rd
- 70 Birchwood St
- 57 Rockland St
- 94 Rockland St
- 110 New Haven St
- 235 Curve St
- 45 Weymouth Ave
- 4975 Washington St Unit 311
- 83 Mount Hope St
- 10 Starling St
- 4959 Washington St
- 14 Starling St
- 85 Stimson St
- 47 Spring Rd
- 91 Stimson St
- 251 Cottage Rd
- 95 Stimson St
- 30 Stimson Rd
- 75 Stimson St
- 34 Stimson Rd
- 34 Stimson Rd Unit 1
- 245 Cottage Rd
- 245 Cottage Rd Unit Single
- 245 Cottage Rd Unit 245 Cottage Rd.
- 245 Cottage Rd
- 245 Cottage Rd Unit 1
- 26 Stimson Rd
- 99 Stimson St
- 29 Camp Rd
- 84-86 Stimson St
- 103 Stimson St
- 71 Stimson St