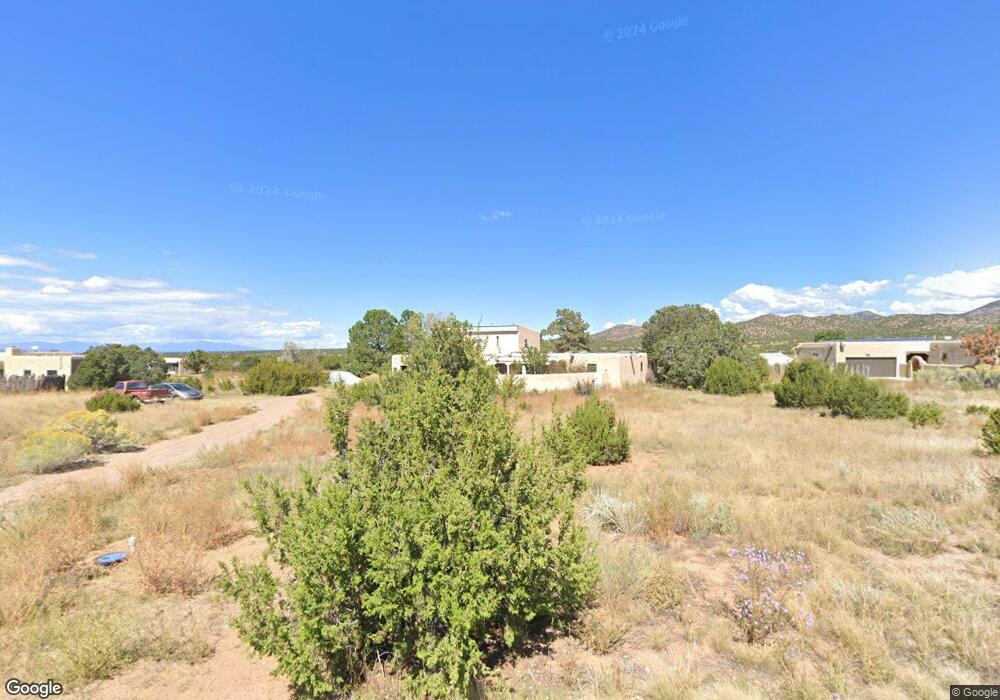
48 Verano Loop Santa Fe, NM 87508
Eldorado at Santa Fe NeighborhoodEstimated Value: $649,000 - $668,000
3
Beds
2
Baths
2,436
Sq Ft
$270/Sq Ft
Est. Value
About This Home
This home is located at 48 Verano Loop, Santa Fe, NM 87508 and is currently estimated at $658,923, approximately $270 per square foot. 48 Verano Loop is a home located in Santa Fe County with nearby schools including El Dorado Community School and Santa Fe High School.
Ownership History
Date
Name
Owned For
Owner Type
Purchase Details
Closed on
Jun 25, 2001
Sold by
Gallett Booth and Gallett Colleen Kelly
Bought by
Gallett Booth and Gallett Colleen Kelly
Current Estimated Value
Home Financials for this Owner
Home Financials are based on the most recent Mortgage that was taken out on this home.
Original Mortgage
$180,000
Outstanding Balance
$64,094
Interest Rate
6.89%
Estimated Equity
$594,829
Purchase Details
Closed on
Apr 30, 2001
Sold by
Gallett Revocable Trust The and Gallett Booth
Bought by
Farmer Andrew D and Farmer Christina E
Home Financials for this Owner
Home Financials are based on the most recent Mortgage that was taken out on this home.
Original Mortgage
$180,000
Outstanding Balance
$64,094
Interest Rate
6.89%
Estimated Equity
$594,829
Purchase Details
Closed on
Feb 22, 2000
Sold by
Gallett Booth and Gallett Colleen
Bought by
Gallett Booth and Gallett Colleen Kelly
Purchase Details
Closed on
Jun 18, 1999
Sold by
Gallett Booth and Gallett Colleen Kelly
Bought by
Trustees Of The Gallett Revocable Trust
Create a Home Valuation Report for This Property
The Home Valuation Report is an in-depth analysis detailing your home's value as well as a comparison with similar homes in the area
Home Values in the Area
Average Home Value in this Area
Purchase History
| Date | Buyer | Sale Price | Title Company |
|---|---|---|---|
| Gallett Booth | -- | -- | |
| Farmer Andrew D | -- | Territorial Abstract & Title | |
| Gallett Booth | -- | Territorial Abstract & Title | |
| Trustees Of The Gallett Revocable Trust | -- | -- |
Source: Public Records
Mortgage History
| Date | Status | Borrower | Loan Amount |
|---|---|---|---|
| Open | Farmer Andrew D | $180,000 | |
| Closed | Farmer Andrew D | $22,500 |
Source: Public Records
Tax History
| Year | Tax Paid | Tax Assessment Tax Assessment Total Assessment is a certain percentage of the fair market value that is determined by local assessors to be the total taxable value of land and additions on the property. | Land | Improvement |
|---|---|---|---|---|
| 2025 | $2,014 | $241,528 | $72,748 | $168,780 |
| 2024 | $1,974 | $234,495 | $70,630 | $163,865 |
| 2023 | $1,976 | $227,666 | $68,573 | $159,093 |
| 2022 | $1,862 | $221,036 | $66,576 | $154,460 |
| 2021 | $1,839 | $71,533 | $21,545 | $49,988 |
| 2020 | $1,806 | $69,450 | $20,918 | $48,532 |
| 2019 | $1,767 | $67,428 | $20,309 | $47,119 |
| 2018 | $1,728 | $65,464 | $19,717 | $45,747 |
| 2017 | $1,681 | $63,558 | $19,143 | $44,415 |
| 2016 | $1,577 | $61,707 | $18,587 | $43,120 |
| 2015 | $1,557 | $59,910 | $18,587 | $41,323 |
| 2014 | $1,597 | $65,621 | $18,568 | $47,053 |
Source: Public Records
Map
Nearby Homes
Your Personal Tour Guide
Ask me questions while you tour the home.