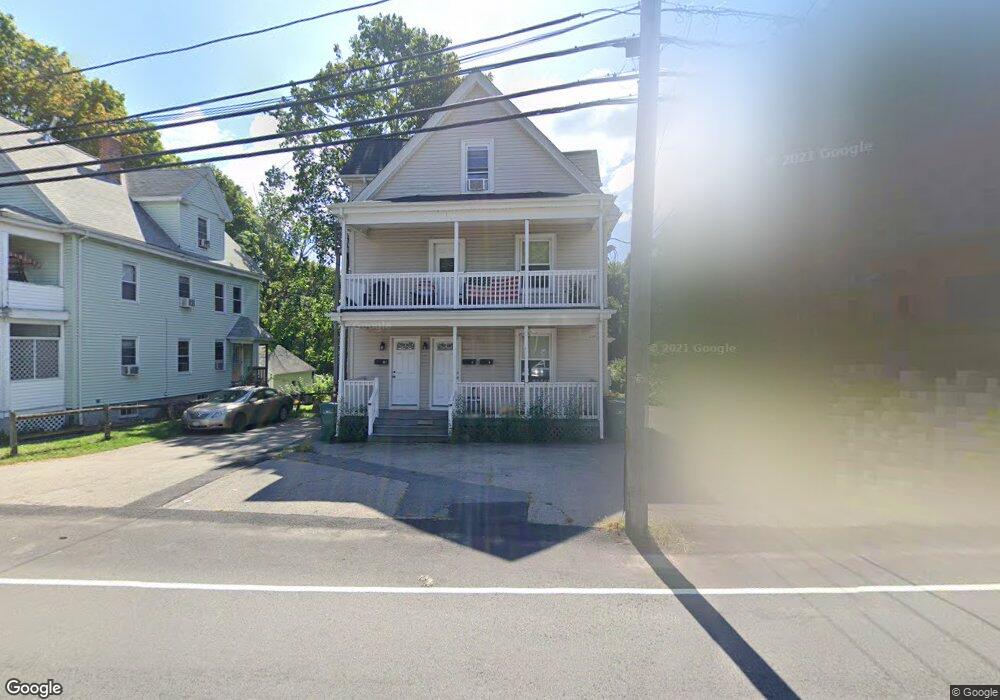
48 West St Attleboro, MA 02703
Estimated Value: $373,775 - $600,000
6
Beds
3
Baths
2,310
Sq Ft
$198/Sq Ft
Est. Value
About This Home
This home is located at 48 West St, Attleboro, MA 02703 and is currently estimated at $457,944, approximately $198 per square foot. 48 West St is a home located in Bristol County with nearby schools including Thomas E. Willett School, Cyril K. Brennan Middle School, and Attleboro High School.
Ownership History
Date
Name
Owned For
Owner Type
Purchase Details
Closed on
Apr 21, 2009
Sold by
Farley James W and Farley Gabriele M
Bought by
Farley Tr James W and Farley Gabriele M
Current Estimated Value
Purchase Details
Closed on
Mar 27, 2006
Sold by
Elliott Rick A and Elliott Linda Lee
Bought by
Farley James W and Farley Gabriele M
Home Financials for this Owner
Home Financials are based on the most recent Mortgage that was taken out on this home.
Original Mortgage
$189,000
Interest Rate
6.28%
Mortgage Type
Purchase Money Mortgage
Create a Home Valuation Report for This Property
The Home Valuation Report is an in-depth analysis detailing your home's value as well as a comparison with similar homes in the area
Home Values in the Area
Average Home Value in this Area
Purchase History
| Date | Buyer | Sale Price | Title Company |
|---|---|---|---|
| Farley Tr James W | -- | -- | |
| Farley James W | $210,000 | -- |
Source: Public Records
Mortgage History
| Date | Status | Borrower | Loan Amount |
|---|---|---|---|
| Previous Owner | Farley James W | $189,000 |
Source: Public Records
Tax History
| Year | Tax Paid | Tax Assessment Tax Assessment Total Assessment is a certain percentage of the fair market value that is determined by local assessors to be the total taxable value of land and additions on the property. | Land | Improvement |
|---|---|---|---|---|
| 2025 | $5,842 | $465,500 | $126,600 | $338,900 |
| 2024 | $5,655 | $444,200 | $126,600 | $317,600 |
| 2023 | $5,041 | $368,200 | $115,100 | $253,100 |
| 2022 | $4,624 | $320,000 | $109,600 | $210,400 |
| 2021 | $4,674 | $302,000 | $105,400 | $196,600 |
| 2020 | $4,187 | $287,600 | $102,400 | $185,200 |
| 2019 | $3,961 | $279,700 | $100,400 | $179,300 |
| 2018 | $4,159 | $246,100 | $97,500 | $148,600 |
| 2017 | $3,616 | $248,500 | $97,500 | $151,000 |
| 2016 | $3,340 | $225,400 | $95,700 | $129,700 |
| 2015 | $3,157 | $214,600 | $95,700 | $118,900 |
| 2014 | $2,930 | $197,300 | $91,200 | $106,100 |
Source: Public Records
Map
Nearby Homes
- 26 West St
- 15 North Ave
- 20 Elizabeth St
- 10 John St
- 149 N Main St Unit B
- 46 Berwick Rd
- 64 Mechanic St Unit 3
- 64 Mechanic St
- 0 Rosedale Ln Unit 73469293
- 75 Dennis St Unit 3
- 18-20 Jefferson St
- 10 Hazelwood Ct
- 21 4th St
- 32 Park St Unit 4
- 160 West St
- 40 Flora Rd
- 41 Flora Rd
- 49 Dennis St
- 747 N Main St
- 147 County St
Your Personal Tour Guide
Ask me questions while you tour the home.