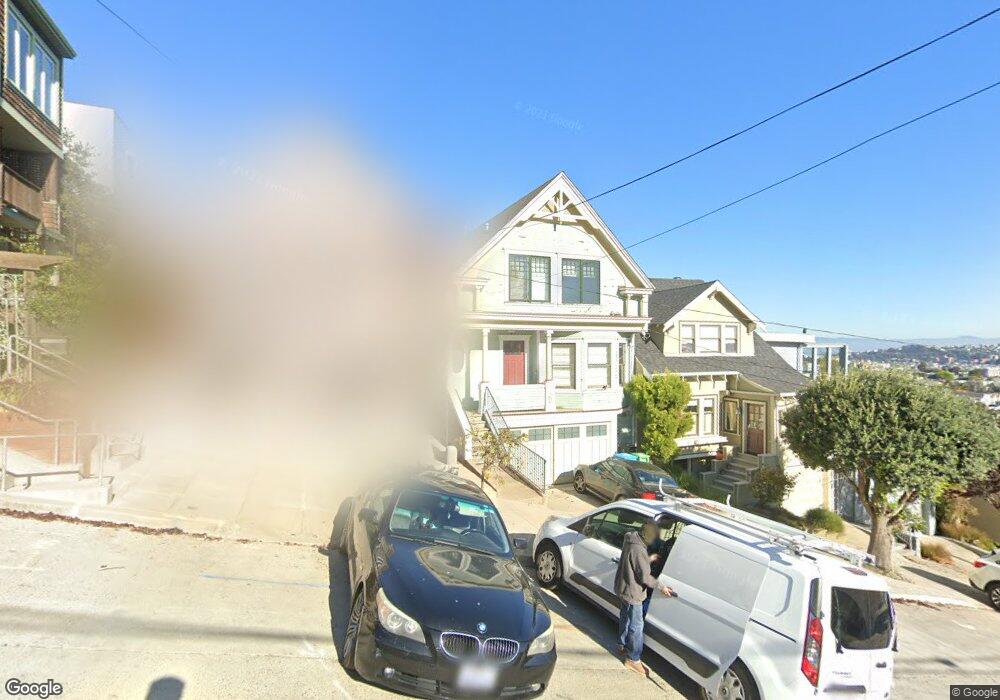
480 Duncan St San Francisco, CA 94131
Noe Valley NeighborhoodEstimated Value: $3,020,000 - $3,338,000
4
Beds
4
Baths
1,950
Sq Ft
$1,609/Sq Ft
Est. Value
About This Home
This home is located at 480 Duncan St, San Francisco, CA 94131 and is currently estimated at $3,137,696, approximately $1,609 per square foot. 480 Duncan St is a home located in San Francisco County with nearby schools including Alvarado Elementary, James Lick Middle School, and Thomas Edison Charter Academy.
Ownership History
Date
Name
Owned For
Owner Type
Purchase Details
Closed on
Feb 23, 2008
Sold by
Harbour Gary and Harbour Leslie
Bought by
Martin Charles
Current Estimated Value
Purchase Details
Closed on
Oct 26, 2006
Sold by
Mohr David C and Mohr Laura M
Bought by
Harbour Gary and Harbour Leslie
Home Financials for this Owner
Home Financials are based on the most recent Mortgage that was taken out on this home.
Original Mortgage
$1,060,000
Interest Rate
6.3%
Mortgage Type
Unknown
Purchase Details
Closed on
Aug 25, 2005
Sold by
Mohr David C
Bought by
Mohr David C and Mohr Laura M
Purchase Details
Closed on
Jun 4, 1997
Sold by
Mohr David C
Bought by
Mohr David C
Purchase Details
Closed on
Jul 6, 1995
Sold by
Bender David M and Bender Jane E
Bought by
Mohr David C
Create a Home Valuation Report for This Property
The Home Valuation Report is an in-depth analysis detailing your home's value as well as a comparison with similar homes in the area
Home Values in the Area
Average Home Value in this Area
Purchase History
| Date | Buyer | Sale Price | Title Company |
|---|---|---|---|
| Martin Charles | $2,200,000 | Stewart Title Guaranty Compa | |
| Harbour Gary | $2,265,000 | First American Title Co | |
| Mohr David C | -- | -- | |
| Mohr David C | -- | -- | |
| Mohr David C | $473,000 | North American Title Company |
Source: Public Records
Mortgage History
| Date | Status | Borrower | Loan Amount |
|---|---|---|---|
| Previous Owner | Harbour Gary | $1,060,000 | |
| Previous Owner | Harbour Gary | $978,500 |
Source: Public Records
Tax History Compared to Growth
Tax History
| Year | Tax Paid | Tax Assessment Tax Assessment Total Assessment is a certain percentage of the fair market value that is determined by local assessors to be the total taxable value of land and additions on the property. | Land | Improvement |
|---|---|---|---|---|
| 2025 | $33,977 | $2,889,730 | $2,035,951 | $853,779 |
| 2024 | $33,977 | $2,833,070 | $1,996,031 | $837,039 |
| 2023 | $33,477 | $2,777,521 | $1,956,894 | $820,627 |
| 2022 | $32,858 | $2,723,061 | $1,918,524 | $804,537 |
| 2021 | $33,802 | $2,669,668 | $1,880,906 | $788,762 |
| 2020 | $34,131 | $2,642,295 | $1,861,620 | $780,675 |
| 2019 | $31,595 | $2,590,486 | $1,825,118 | $765,368 |
| 2018 | $30,280 | $2,539,693 | $1,789,332 | $750,361 |
| 2017 | $30,220 | $2,489,897 | $1,754,248 | $735,649 |
| 2016 | $29,765 | $2,441,076 | $1,719,851 | $721,225 |
| 2015 | $30,392 | $2,404,410 | $1,694,018 | $710,392 |
| 2014 | $28,056 | $2,357,312 | $1,660,835 | $696,477 |
Source: Public Records
Map
Nearby Homes