480 Meadow Glen Dr Fallon, NV 89406
Estimated Value: $347,000 - $372,000
3
Beds
2
Baths
1,576
Sq Ft
$228/Sq Ft
Est. Value
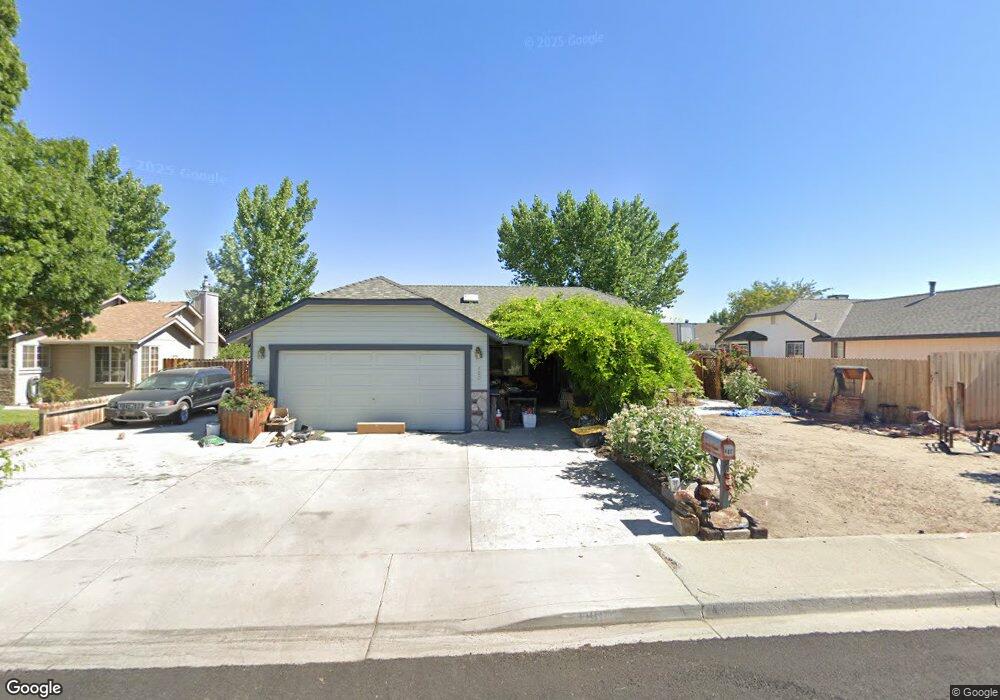
About This Home
This home is located at 480 Meadow Glen Dr, Fallon, NV 89406 and is currently estimated at $359,757, approximately $228 per square foot. 480 Meadow Glen Dr is a home located in Churchill County with nearby schools including E.C. Best Elementary School, Numa Elementary School, and Lahontan Elementary School.
Ownership History
Date
Name
Owned For
Owner Type
Purchase Details
Closed on
Nov 13, 2013
Sold by
Richardson Stuart
Bought by
Conway Deborah S
Current Estimated Value
Home Financials for this Owner
Home Financials are based on the most recent Mortgage that was taken out on this home.
Original Mortgage
$79,250
Outstanding Balance
$21,075
Interest Rate
4.17%
Estimated Equity
$338,682
Purchase Details
Closed on
Jun 15, 2009
Sold by
Scobert Trisha D
Bought by
Conway Deborah S
Purchase Details
Closed on
Jan 11, 2005
Sold by
Conway Deborah S
Bought by
Conway Deborah S and Scobert Trisha D
Create a Home Valuation Report for This Property
The Home Valuation Report is an in-depth analysis detailing your home's value as well as a comparison with similar homes in the area
Home Values in the Area
Average Home Value in this Area
Purchase History
We collect this data history from publicly available records. To have your information removed, we recommend requesting removal directly through your county’s website.
| Date | Buyer | Sale Price | Title Company |
|---|---|---|---|
| Conway Deborah S | -- | Western Nevada Title Company | |
| Conway Deborah S | -- | None Available | |
| Conway Deborah S | -- | Stewart Title Company |
Source: Public Records
Mortgage History
We collect this data history from publicly available records. To have your information removed, we recommend requesting removal directly through your county’s website.
| Date | Status | Borrower | Loan Amount |
|---|---|---|---|
| Open | Conway Deborah S | $79,250 |
Source: Public Records
Tax History
| Year | Tax Paid | Tax Assessment Tax Assessment Total Assessment is a certain percentage of the fair market value that is determined by local assessors to be the total taxable value of land and additions on the property. | Land | Improvement |
|---|---|---|---|---|
| 2025 | $1,976 | $76,858 | $21,700 | $55,158 |
| 2024 | $1,976 | $75,972 | $19,950 | $56,022 |
| 2023 | $1,976 | $72,564 | $19,950 | $52,614 |
| 2022 | $1,859 | $57,712 | $11,900 | $45,812 |
| 2021 | $1,803 | $56,641 | $11,900 | $44,741 |
| 2020 | $1,746 | $55,057 | $11,900 | $43,157 |
| 2019 | $1,725 | $54,097 | $11,900 | $42,197 |
| 2018 | $1,646 | $53,258 | $11,900 | $41,358 |
| 2017 | $1,598 | $52,059 | $10,500 | $41,559 |
| 2016 | $1,558 | $46,553 | $7,875 | $38,678 |
| 2015 | $1,528 | $42,262 | $7,875 | $34,387 |
| 2014 | $1,490 | $39,389 | $7,875 | $31,514 |
Source: Public Records
Map
Nearby Homes
- 461 Pintail Dr
- 540 Michael Dr
- 430 Pintail Dr
- 358 Dianna Way
- 804 Maple Way
- 836 Maple Way
- 1049 Tamarack Ct
- 765 Hunter Park Way
- 1135 Tamarack Dr
- 894 Timothy Way
- 829 Great Basin Ln
- 606 Sycamore Dr
- 815 Great Basin Ln
- 630 Keppel St
- 618 Keppel St
- 455 Sunrise Terrace
- 009-291-74 00929174
- 1755 Coleman Rd
- 1100 Venturacci Ln
- 210 S Taylor St
- 500 Meadow Glen Dr
- 460 Meadow Glen Dr
- 481 Keddie St
- 501 Keddie St
- 461 Keddie St
- 520 Meadow Glen Dr
- 440 Meadow Glen Dr
- 440 Meadow
- 521 Keddie St Unit 7
- 400 Meadow Glen Dr
- 481 Meadow Glen Dr
- 111 Keddie St
- 480 Pintail Dr
- 471 Meadow Glen Dr
- 530 Meadow Glen Dr
- 541 Keddie St
- 481 Pintail Dr
- 461 Meadow Glen Dr
- 506 Keddie St
- 492 Keddie St
Your Personal Tour Guide
Ask me questions while you tour the home.