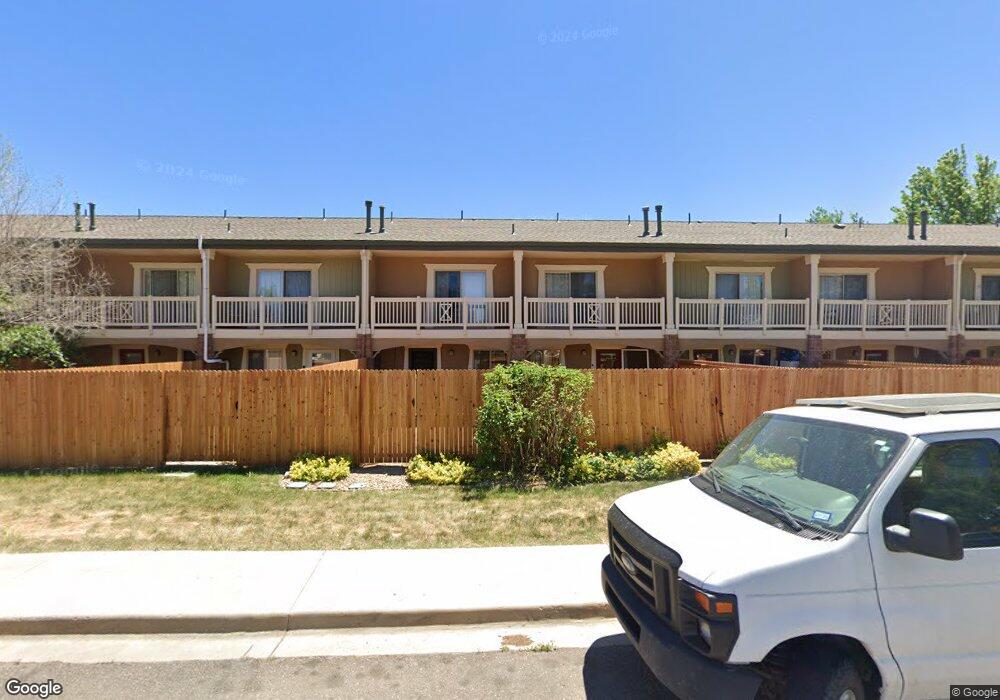
4800 Osage Dr Unit 17B Boulder, CO 80303
Southeast Boulder NeighborhoodEstimated Value: $464,213 - $502,000
2
Beds
2
Baths
918
Sq Ft
$525/Sq Ft
Est. Value
About This Home
This home is located at 4800 Osage Dr Unit 17B, Boulder, CO 80303 and is currently estimated at $482,303, approximately $525 per square foot. 4800 Osage Dr Unit 17B is a home located in Boulder County with nearby schools including Eisenhower Elementary School, Manhattan Middle School of the Arts & Academics, and Fairview High School.
Ownership History
Date
Name
Owned For
Owner Type
Purchase Details
Closed on
Nov 11, 2013
Sold by
Stacishin Moura Liliane
Bought by
Stacishin Moura Liliane and Volpe Michael Rick
Current Estimated Value
Purchase Details
Closed on
Aug 1, 2013
Sold by
Rogers Christine Elizabeth and Brandt Christine E
Bought by
Stacishin Moura Liliane
Home Financials for this Owner
Home Financials are based on the most recent Mortgage that was taken out on this home.
Original Mortgage
$102,000
Outstanding Balance
$74,439
Interest Rate
3.93%
Mortgage Type
New Conventional
Estimated Equity
$407,864
Purchase Details
Closed on
Jun 23, 2005
Sold by
Osage 36 Llc
Bought by
Brandt Christine E
Home Financials for this Owner
Home Financials are based on the most recent Mortgage that was taken out on this home.
Original Mortgage
$204,950
Interest Rate
6%
Mortgage Type
Unknown
Create a Home Valuation Report for This Property
The Home Valuation Report is an in-depth analysis detailing your home's value as well as a comparison with similar homes in the area
Home Values in the Area
Average Home Value in this Area
Purchase History
| Date | Buyer | Sale Price | Title Company |
|---|---|---|---|
| Stacishin Moura Liliane | -- | None Available | |
| Stacishin Moura Liliane | $259,500 | First Colorado Title | |
| Brandt Christine E | $256,200 | Security Title |
Source: Public Records
Mortgage History
| Date | Status | Borrower | Loan Amount |
|---|---|---|---|
| Open | Stacishin Moura Liliane | $102,000 | |
| Previous Owner | Brandt Christine E | $204,950 |
Source: Public Records
Tax History
| Year | Tax Paid | Tax Assessment Tax Assessment Total Assessment is a certain percentage of the fair market value that is determined by local assessors to be the total taxable value of land and additions on the property. | Land | Improvement |
|---|---|---|---|---|
| 2025 | $2,591 | $29,738 | -- | $29,738 |
| 2024 | $2,591 | $29,738 | -- | $29,738 |
| 2023 | $2,544 | $28,589 | -- | $32,274 |
| 2022 | $2,801 | $29,357 | $0 | $29,357 |
| 2021 | $2,675 | $30,202 | $0 | $30,202 |
| 2020 | $2,466 | $28,335 | $0 | $28,335 |
| 2019 | $2,429 | $28,335 | $0 | $28,335 |
| 2018 | $2,137 | $24,646 | $0 | $24,646 |
| 2017 | $2,070 | $27,247 | $0 | $27,247 |
| 2016 | $2,024 | $23,386 | $0 | $23,386 |
| 2015 | $1,917 | $18,563 | $0 | $18,563 |
| 2014 | $1,596 | $18,563 | $0 | $18,563 |
Source: Public Records
Map
Nearby Homes
- 4800 Osage Dr Unit B-16
- 167 Cherokee Way
- 15 Pawnee Dr
- 4521 Navajo Place
- 4835 Moorhead Ave
- 210 Manhattan Dr
- 20 S Boulder Cir Unit 20-2204
- 4595 Moorhead Ave
- 33 S Boulder Cir Unit 316
- 33 S Boulder Cir Unit 306
- 40 S Boulder Cir Unit 4034
- 30 S Boulder Cir Unit 3018
- 4453 Hamilton Ct
- 4763 Tantra Dr Unit B
- 750 W Moorhead Cir Unit A
- 755 W Moorhead Cir Unit B
- 501 Manhattan Dr Unit 101
- 800 W Moorhead Cir Unit E
- 860 W Moorhead Cir Unit 2K
- 860 W Moorhead Cir Unit 1I
- 4800 Osage Dr Unit 35C
- 4800 Osage Dr Unit 34C
- 4800 Osage Dr Unit 33C
- 4800 Osage Dr Unit 32C
- 4800 Osage Dr Unit 31C
- 4800 Osage Dr Unit 30C
- 4800 Osage Dr Unit 29C
- 4800 Osage Dr Unit 28C
- 4800 Osage Dr Unit 27C
- 4800 Osage Dr Unit 26C
- 4800 Osage Dr Unit 25C
- 4800 Osage Dr Unit 24C
- 4800 Osage Dr Unit 23B
- 4800 Osage Dr Unit 21B
- 4800 Osage Dr Unit 20B
- 4800 Osage Dr Unit 19B
- 4800 Osage Dr Unit 18B
- 4800 Osage Dr Unit 16B
- 4800 Osage Dr Unit 15B
- 4800 Osage Dr Unit 14B
Your Personal Tour Guide
Ask me questions while you tour the home.