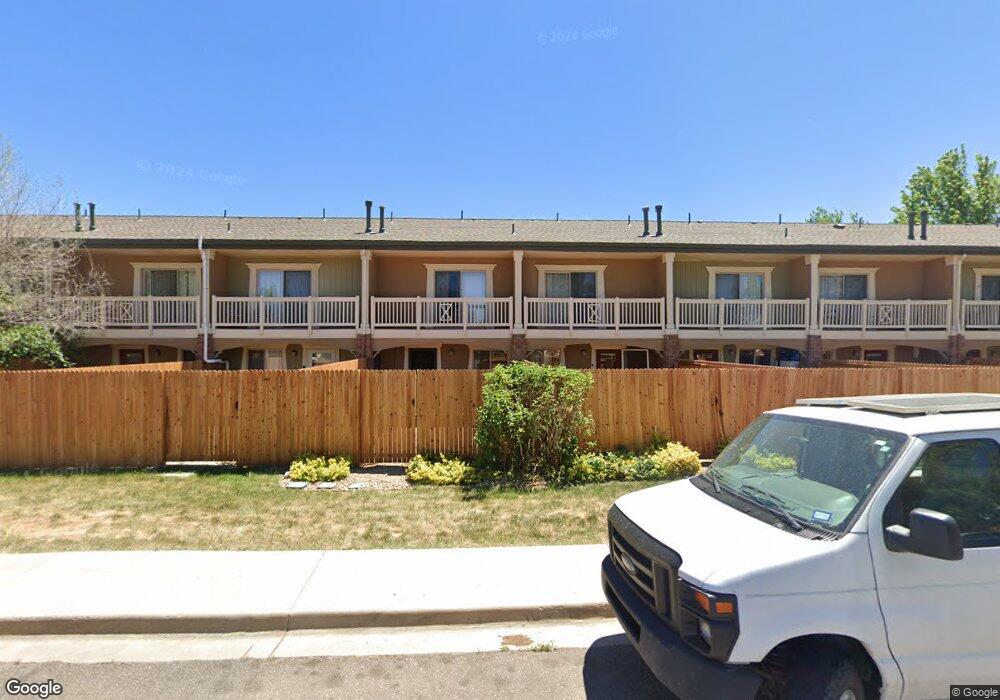
4800 Osage Dr Unit 35C Boulder, CO 80303
Southeast Boulder NeighborhoodEstimated Value: $474,000 - $500,000
2
Beds
2
Baths
918
Sq Ft
$526/Sq Ft
Est. Value
About This Home
This home is located at 4800 Osage Dr Unit 35C, Boulder, CO 80303 and is currently estimated at $483,128, approximately $526 per square foot. 4800 Osage Dr Unit 35C is a home located in Boulder County with nearby schools including Eisenhower Elementary School, Manhattan Middle School of the Arts & Academics, and Fairview High School.
Ownership History
Date
Name
Owned For
Owner Type
Purchase Details
Closed on
Nov 21, 2022
Sold by
Stevens Jacquelyn
Bought by
Broad Amanda Jo
Current Estimated Value
Home Financials for this Owner
Home Financials are based on the most recent Mortgage that was taken out on this home.
Original Mortgage
$459,000
Outstanding Balance
$445,102
Interest Rate
7.08%
Mortgage Type
New Conventional
Estimated Equity
$38,026
Purchase Details
Closed on
Sep 9, 2010
Sold by
Semmens Michael G and Semmens Cheryl
Bought by
Stevens Kenton
Home Financials for this Owner
Home Financials are based on the most recent Mortgage that was taken out on this home.
Original Mortgage
$238,958
Interest Rate
4.37%
Mortgage Type
FHA
Purchase Details
Closed on
Aug 8, 2005
Sold by
Osage 36 Llc
Bought by
Semmens Michael G
Home Financials for this Owner
Home Financials are based on the most recent Mortgage that was taken out on this home.
Original Mortgage
$200,000
Interest Rate
5%
Mortgage Type
Fannie Mae Freddie Mac
Create a Home Valuation Report for This Property
The Home Valuation Report is an in-depth analysis detailing your home's value as well as a comparison with similar homes in the area
Home Values in the Area
Average Home Value in this Area
Purchase History
| Date | Buyer | Sale Price | Title Company |
|---|---|---|---|
| Broad Amanda Jo | $510,000 | -- | |
| Stevens Kenton | $246,000 | Heritage Title | |
| Semmens Michael G | $250,450 | Security Title |
Source: Public Records
Mortgage History
| Date | Status | Borrower | Loan Amount |
|---|---|---|---|
| Open | Broad Amanda Jo | $459,000 | |
| Previous Owner | Stevens Kenton | $238,958 | |
| Previous Owner | Semmens Michael G | $200,000 |
Source: Public Records
Tax History Compared to Growth
Tax History
| Year | Tax Paid | Tax Assessment Tax Assessment Total Assessment is a certain percentage of the fair market value that is determined by local assessors to be the total taxable value of land and additions on the property. | Land | Improvement |
|---|---|---|---|---|
| 2025 | $2,513 | $29,738 | -- | $29,738 |
| 2024 | $2,513 | $29,738 | -- | $29,738 |
| 2023 | $2,469 | $28,589 | -- | $32,274 |
| 2022 | $2,801 | $29,357 | $0 | $29,357 |
| 2021 | $2,675 | $30,202 | $0 | $30,202 |
| 2020 | $2,466 | $28,335 | $0 | $28,335 |
| 2019 | $2,429 | $28,335 | $0 | $28,335 |
| 2018 | $2,137 | $24,646 | $0 | $24,646 |
| 2017 | $2,070 | $27,247 | $0 | $27,247 |
| 2016 | $2,024 | $23,386 | $0 | $23,386 |
| 2015 | $1,917 | $18,563 | $0 | $18,563 |
| 2014 | $1,596 | $18,563 | $0 | $18,563 |
Source: Public Records
Map
Nearby Homes
- 4835 Moorhead Ave
- 20 S Boulder Cir Unit 2312
- 20 S Boulder Cir Unit 2314
- 20 S Boulder Cir Unit 2109
- 33 S Boulder Cir Unit 306
- 611 Tantra Dr
- 4763 Tantra Dr Unit B
- 500 Mohawk Dr Unit 510
- 750 W Moorhead Cir Unit A
- 500 Manhattan Dr Unit B1
- 800 W Moorhead Cir Unit E
- 860 W Moorhead Cir Unit I
- 860 W Moorhead Cir Unit 2K
- 860 W Moorhead Cir Unit 2H
- 850 W Moorhead Cir Unit 3L
- 625 Manhattan Place Unit 308
- 645 Manhattan Place Unit 302
- 645 Manhattan Place Unit 304
- 725 S 45th St
- 450 S 41st St
- 4800 Osage Dr Unit 34C
- 4800 Osage Dr Unit 33C
- 4800 Osage Dr Unit 32C
- 4800 Osage Dr Unit 31C
- 4800 Osage Dr Unit 30C
- 4800 Osage Dr Unit 29C
- 4800 Osage Dr Unit 28C
- 4800 Osage Dr Unit 27C
- 4800 Osage Dr Unit 26C
- 4800 Osage Dr Unit 25C
- 4800 Osage Dr Unit 24C
- 4800 Osage Dr Unit 23B
- 4800 Osage Dr Unit 21B
- 4800 Osage Dr Unit 20B
- 4800 Osage Dr Unit 19B
- 4800 Osage Dr Unit 18B
- 4800 Osage Dr Unit 17B
- 4800 Osage Dr Unit 16B
- 4800 Osage Dr Unit 15B
- 4800 Osage Dr Unit 14B