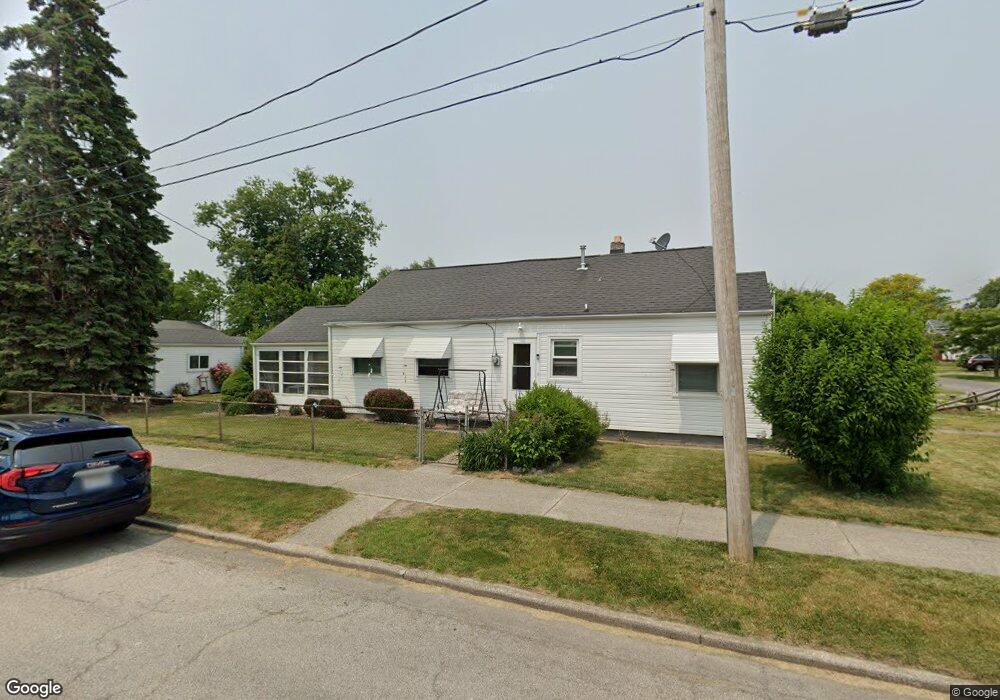
4801 293rd St Toledo, OH 43611
Point Place NeighborhoodEstimated Value: $127,906 - $138,000
2
Beds
1
Bath
1,032
Sq Ft
$129/Sq Ft
Est. Value
About This Home
This home is located at 4801 293rd St, Toledo, OH 43611 and is currently estimated at $133,227, approximately $129 per square foot. 4801 293rd St is a home located in Lucas County with nearby schools including Ottawa River Elementary School, Woodward High School, and Imagine Environmental Science Academy.
Ownership History
Date
Name
Owned For
Owner Type
Purchase Details
Closed on
Dec 6, 2010
Sold by
Beneficial Ohio Inc
Bought by
Smith James H and Smith Donna D
Current Estimated Value
Purchase Details
Closed on
Oct 4, 2010
Sold by
Radlinski David and Radlinski Margaret A
Bought by
Beneficial Ohio Inc and Benificial Mortgage Co
Create a Home Valuation Report for This Property
The Home Valuation Report is an in-depth analysis detailing your home's value as well as a comparison with similar homes in the area
Home Values in the Area
Average Home Value in this Area
Purchase History
| Date | Buyer | Sale Price | Title Company |
|---|---|---|---|
| Smith James H | $36,000 | Attorney | |
| Beneficial Ohio Inc | $50,000 | None Available |
Source: Public Records
Tax History Compared to Growth
Tax History
| Year | Tax Paid | Tax Assessment Tax Assessment Total Assessment is a certain percentage of the fair market value that is determined by local assessors to be the total taxable value of land and additions on the property. | Land | Improvement |
|---|---|---|---|---|
| 2024 | $1,070 | $32,795 | $8,855 | $23,940 |
| 2023 | $1,752 | $25,130 | $7,910 | $17,220 |
| 2022 | $1,752 | $25,130 | $7,910 | $17,220 |
| 2021 | $1,779 | $25,130 | $7,910 | $17,220 |
| 2020 | $1,712 | $20,790 | $6,475 | $14,315 |
| 2019 | $1,654 | $20,790 | $6,475 | $14,315 |
| 2018 | $1,671 | $20,790 | $6,475 | $14,315 |
| 2017 | $1,692 | $20,265 | $6,195 | $14,070 |
| 2016 | $1,712 | $57,900 | $17,700 | $40,200 |
| 2015 | $1,703 | $57,900 | $17,700 | $40,200 |
| 2014 | $1,275 | $20,270 | $6,200 | $14,070 |
| 2013 | $1,275 | $20,270 | $6,200 | $14,070 |
Source: Public Records
Map
Nearby Homes