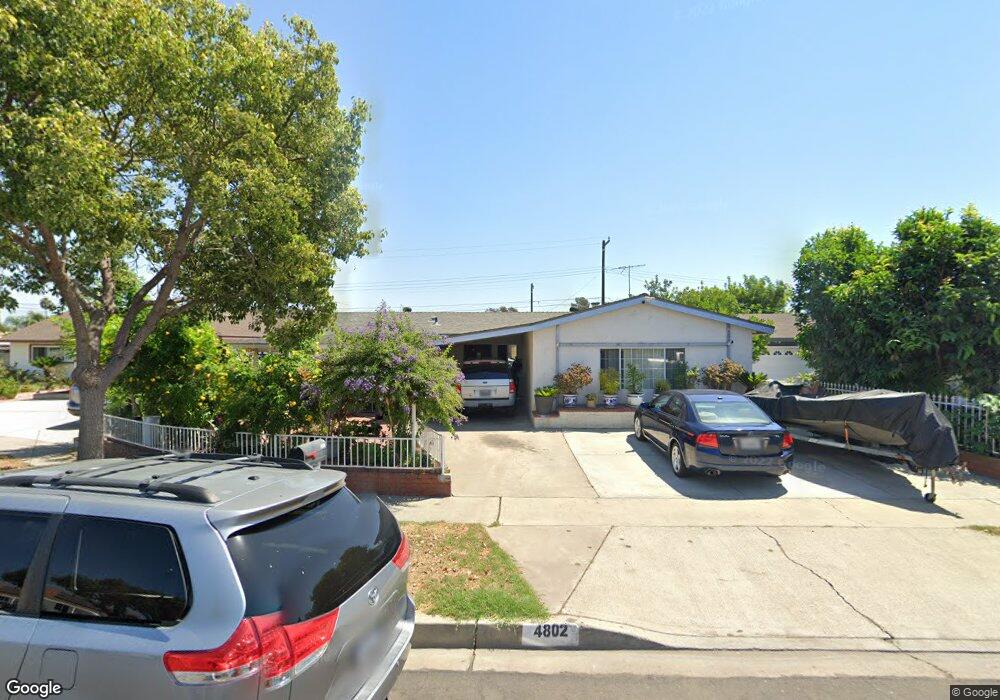
4802 W 6th St Santa Ana, CA 92703
Riverview West NeighborhoodEstimated Value: $908,000 - $1,152,000
5
Beds
2
Baths
2,132
Sq Ft
$469/Sq Ft
Est. Value
About This Home
This home is located at 4802 W 6th St, Santa Ana, CA 92703 and is currently estimated at $999,649, approximately $468 per square foot. 4802 W 6th St is a home located in Orange County with nearby schools including Rosita Elementary School, James Irvine Intermediate School, and Los Amigos High School.
Ownership History
Date
Name
Owned For
Owner Type
Purchase Details
Closed on
Mar 9, 2005
Sold by
Dao Ngan Huu and Dao Hoang Lam
Bought by
Dao Hoang Lam and Dao Deric Quang Lam
Current Estimated Value
Purchase Details
Closed on
Jan 14, 2000
Sold by
Ngan Dao
Bought by
Dao Ngan Huu and Dao Hoang Lam
Purchase Details
Closed on
Mar 19, 1998
Sold by
Ngan Dao and Ngan Ngoc Lam
Bought by
Dao Ngan Huu
Home Financials for this Owner
Home Financials are based on the most recent Mortgage that was taken out on this home.
Original Mortgage
$153,000
Outstanding Balance
$27,990
Interest Rate
7.02%
Estimated Equity
$971,659
Purchase Details
Closed on
Aug 15, 1994
Sold by
Dao Ngan Huu and Dao Minh Lam
Bought by
Dao Ngan Huu and Lam Ngoc
Purchase Details
Closed on
Feb 23, 1994
Sold by
Dao Hoang Lam
Bought by
Dao Ngan Huu and Dao Minh Lam
Purchase Details
Closed on
Oct 18, 1993
Sold by
Tran Hanh Dung
Bought by
Dao Hoang Lam
Create a Home Valuation Report for This Property
The Home Valuation Report is an in-depth analysis detailing your home's value as well as a comparison with similar homes in the area
Home Values in the Area
Average Home Value in this Area
Purchase History
| Date | Buyer | Sale Price | Title Company |
|---|---|---|---|
| Dao Hoang Lam | -- | -- | |
| Dao Ngan Huu | -- | -- | |
| Dao Ngan Huu | -- | Landwood Title Company | |
| Dao Ngan Huu | -- | -- | |
| Dao Ngan Huu | -- | -- | |
| Dao Hoang Lam | -- | -- |
Source: Public Records
Mortgage History
| Date | Status | Borrower | Loan Amount |
|---|---|---|---|
| Open | Dao Ngan Huu | $153,000 |
Source: Public Records
Tax History Compared to Growth
Tax History
| Year | Tax Paid | Tax Assessment Tax Assessment Total Assessment is a certain percentage of the fair market value that is determined by local assessors to be the total taxable value of land and additions on the property. | Land | Improvement |
|---|---|---|---|---|
| 2025 | $4,406 | $367,944 | $263,226 | $104,718 |
| 2024 | $4,406 | $360,730 | $258,065 | $102,665 |
| 2023 | $4,324 | $353,657 | $253,005 | $100,652 |
| 2022 | $4,227 | $346,723 | $248,044 | $98,679 |
| 2021 | $4,169 | $339,925 | $243,180 | $96,745 |
| 2020 | $4,119 | $336,440 | $240,687 | $95,753 |
| 2019 | $4,066 | $329,844 | $235,968 | $93,876 |
| 2018 | $3,966 | $323,377 | $231,341 | $92,036 |
| 2017 | $3,927 | $317,037 | $226,805 | $90,232 |
| 2016 | $3,756 | $310,821 | $222,358 | $88,463 |
| 2015 | $3,707 | $306,153 | $219,018 | $87,135 |
| 2014 | $3,620 | $300,156 | $214,727 | $85,429 |
Source: Public Records
Map
Nearby Homes
- 4832 W 5th St Unit B
- 323 N Euclid St Unit 99
- 14376 Euclid St Unit 1-4
- 4248 W 5th St
- 4201 W 5th St Unit 314
- 4518 W 1st St
- 5317 Silver Dr
- 13322 Euclid St
- 10886 Lotus Dr
- 5114 W 1st St Unit C
- 5405 W 4th St
- 5112 W 1st St Unit C
- 5132 W 1st St Unit B
- 1114 N Gates St
- 3932 W 5th St Unit 202
- 3929 W 5th St Unit 16
- 1609 N Parsons Place
- 14356 Taft St
- 12591 #114 Westminster
- 526 W Tribella Ct