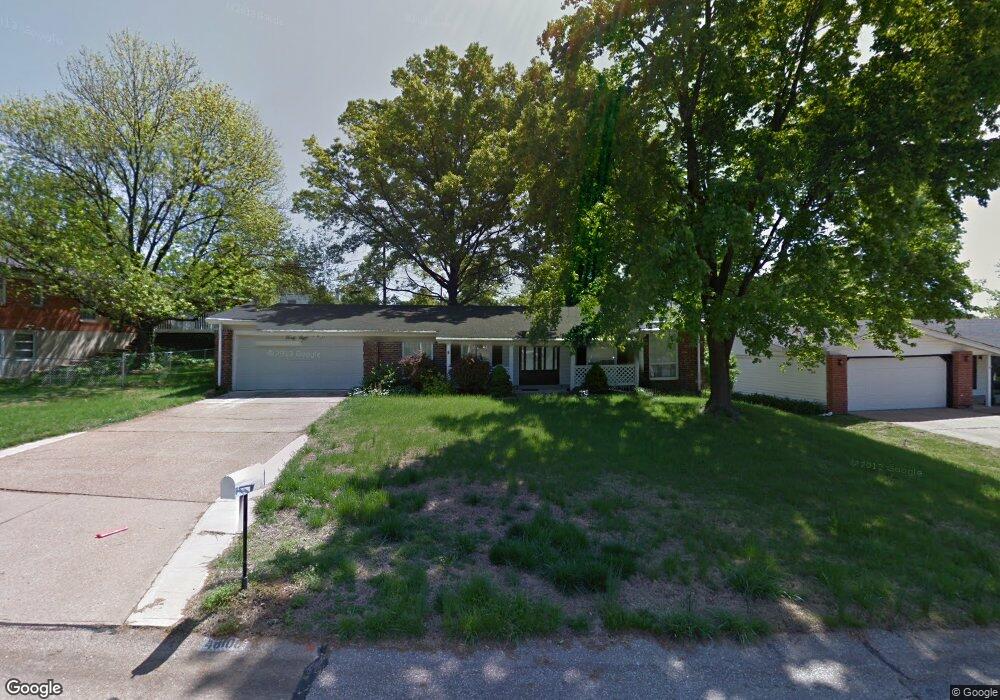
4808 Morestead Dr Saint Louis, MO 63128
Estimated Value: $327,535 - $363,000
4
Beds
2
Baths
1,765
Sq Ft
$198/Sq Ft
Est. Value
About This Home
This home is located at 4808 Morestead Dr, Saint Louis, MO 63128 and is currently estimated at $349,634, approximately $198 per square foot. 4808 Morestead Dr is a home located in St. Louis County with nearby schools including Kennerly Elementary School, Sperreng Middle School, and Lindbergh High School.
Ownership History
Date
Name
Owned For
Owner Type
Purchase Details
Closed on
Oct 17, 2014
Sold by
Brown Ted G and Brown Susan C
Bought by
Nugent Karen K
Current Estimated Value
Home Financials for this Owner
Home Financials are based on the most recent Mortgage that was taken out on this home.
Original Mortgage
$128,000
Outstanding Balance
$98,203
Interest Rate
4.12%
Mortgage Type
New Conventional
Estimated Equity
$251,431
Purchase Details
Closed on
Jan 2, 2004
Sold by
Penrod Gary and Penrod Florine
Bought by
Brown Ted G and Brown Susan C
Home Financials for this Owner
Home Financials are based on the most recent Mortgage that was taken out on this home.
Original Mortgage
$152,148
Interest Rate
5.9%
Mortgage Type
FHA
Purchase Details
Closed on
Jun 13, 2003
Sold by
Jones Alfreda H and Johnson Carl Dee
Bought by
Penrod Gary and Penrod Florine
Home Financials for this Owner
Home Financials are based on the most recent Mortgage that was taken out on this home.
Original Mortgage
$125,000
Interest Rate
5.56%
Mortgage Type
Purchase Money Mortgage
Purchase Details
Closed on
Jul 18, 1997
Sold by
Wagganer Scott K and Wagganer Lisa M
Bought by
Jones Herman and Jones Alfreda H
Create a Home Valuation Report for This Property
The Home Valuation Report is an in-depth analysis detailing your home's value as well as a comparison with similar homes in the area
Home Values in the Area
Average Home Value in this Area
Purchase History
| Date | Buyer | Sale Price | Title Company |
|---|---|---|---|
| Nugent Karen K | $160,000 | Us Title | |
| Brown Ted G | $174,900 | -- | |
| Penrod Gary | $125,000 | -- | |
| Jones Herman | -- | -- |
Source: Public Records
Mortgage History
| Date | Status | Borrower | Loan Amount |
|---|---|---|---|
| Open | Nugent Karen K | $128,000 | |
| Previous Owner | Brown Ted G | $152,148 | |
| Previous Owner | Penrod Gary | $125,000 |
Source: Public Records
Tax History Compared to Growth
Tax History
| Year | Tax Paid | Tax Assessment Tax Assessment Total Assessment is a certain percentage of the fair market value that is determined by local assessors to be the total taxable value of land and additions on the property. | Land | Improvement |
|---|---|---|---|---|
| 2025 | $3,438 | $60,460 | $15,090 | $45,370 |
| 2024 | $3,438 | $52,790 | $15,090 | $37,700 |
| 2023 | $3,429 | $52,790 | $15,090 | $37,700 |
| 2022 | $2,893 | $42,680 | $15,090 | $27,590 |
| 2021 | $2,791 | $42,680 | $15,090 | $27,590 |
| 2020 | $2,738 | $40,400 | $15,090 | $25,310 |
| 2019 | $2,731 | $40,400 | $15,090 | $25,310 |
| 2018 | $2,461 | $33,070 | $9,220 | $23,850 |
| 2017 | $2,434 | $33,070 | $9,220 | $23,850 |
| 2016 | $2,328 | $30,020 | $8,400 | $21,620 |
| 2015 | $2,293 | $30,020 | $8,400 | $21,620 |
| 2014 | $2,805 | $36,450 | $7,470 | $28,980 |
Source: Public Records
Map
Nearby Homes
- 4839 Hursley Dr
- 4833 Hursley Dr
- 4942 Caribee Dr
- 4801 Langtree Dr
- 5135 Towne Centre Dr
- 4645 Tauneybrook Dr
- 4643 Littlebury Dr
- 5100 Melitta Dr
- 5057 Peyton Place Ct
- 4818 Chapel Hill Dr
- 4915 Butler Hill Rd
- 4947 Butler Hill Rd
- 5161 Butler Bend Dr
- 4449 Pinyon Jay Ct
- 4829 Vermilion Dr
- 5263 Faro Dr
- 5317 Hamlin Ct
- 10016 Schuessler Rd
- 4921 Kerth Rd
- 4931 Theiss Rd
- 4914 Sherborne Dr
- 4811 Towne South Rd
- 4904 Sherborne Dr
- 4822 Morestead Dr
- 4807 Morestead Dr
- 4817 Towne South Rd
- 4817 Towne Rd S
- 4815 Morestead Dr
- 4801 Morestead Dr
- 4821 Morestead Dr
- 4823 Towne South Rd
- 4828 Morestead Dr
- 4917 Sherborne Dr
- 4905 Sherborne Dr
- 4810 Holmeswood Ct
- 4827 Morestead Dr
- 4824 Holmeswood Ct
- 4800 Holmeswood Ct
- 4814 Towne South Rd
- 4925 Sherborne Dr