Estimated Value: $517,358 - $589,000
3
Beds
3
Baths
1,281
Sq Ft
$430/Sq Ft
Est. Value
About This Home
This home is located at 4809 Ranch Rd, Chino, CA 91710 and is currently estimated at $551,340, approximately $430 per square foot. 4809 Ranch Rd is a home located in San Bernardino County with nearby schools including Dickson Elementary, Ramona Junior High School, and Don Antonio Lugo High School.
Ownership History
Date
Name
Owned For
Owner Type
Purchase Details
Closed on
Nov 21, 1997
Sold by
Nanadiego Maria S
Bought by
Jocom Corazon S
Current Estimated Value
Home Financials for this Owner
Home Financials are based on the most recent Mortgage that was taken out on this home.
Original Mortgage
$89,794
Outstanding Balance
$14,659
Interest Rate
7.22%
Mortgage Type
FHA
Estimated Equity
$536,681
Purchase Details
Closed on
Jul 16, 1997
Sold by
Nanadiego Antonio V
Bought by
Nanadiego Maria S
Purchase Details
Closed on
Mar 5, 1997
Sold by
Camarena Lorenzo R and Camarena Guadalupe A
Bought by
Ge Capital Mtg Services Inc
Purchase Details
Closed on
Jan 10, 1996
Sold by
Camarena Lorenzo R and Camarena Guadalupe A
Bought by
G E Capital
Create a Home Valuation Report for This Property
The Home Valuation Report is an in-depth analysis detailing your home's value as well as a comparison with similar homes in the area
Home Values in the Area
Average Home Value in this Area
Purchase History
| Date | Buyer | Sale Price | Title Company |
|---|---|---|---|
| Jocom Corazon S | $90,000 | Northern Counties Title Ins | |
| Nanadiego Maria S | -- | Northern Counties Title Co | |
| Nanadiego Maria S | $59,500 | Northern Counties Title Co | |
| Ge Capital Mtg Services Inc | $113,318 | Continental Lawyers Title Co | |
| G E Capital | -- | -- |
Source: Public Records
Mortgage History
| Date | Status | Borrower | Loan Amount |
|---|---|---|---|
| Open | Jocom Corazon S | $89,794 |
Source: Public Records
Tax History
| Year | Tax Paid | Tax Assessment Tax Assessment Total Assessment is a certain percentage of the fair market value that is determined by local assessors to be the total taxable value of land and additions on the property. | Land | Improvement |
|---|---|---|---|---|
| 2025 | $1,546 | $143,711 | $31,937 | $111,774 |
| 2024 | $1,504 | $140,893 | $31,311 | $109,582 |
| 2023 | $1,462 | $138,130 | $30,697 | $107,433 |
| 2022 | $1,452 | $135,421 | $30,095 | $105,326 |
| 2021 | $1,422 | $132,766 | $29,505 | $103,261 |
| 2020 | $1,403 | $131,404 | $29,202 | $102,202 |
| 2019 | $1,377 | $128,827 | $28,629 | $100,198 |
| 2018 | $1,346 | $126,301 | $28,068 | $98,233 |
| 2017 | $1,320 | $123,825 | $27,518 | $96,307 |
| 2016 | $1,234 | $121,397 | $26,978 | $94,419 |
| 2015 | $1,208 | $119,574 | $26,573 | $93,001 |
| 2014 | $1,183 | $117,231 | $26,052 | $91,179 |
Source: Public Records
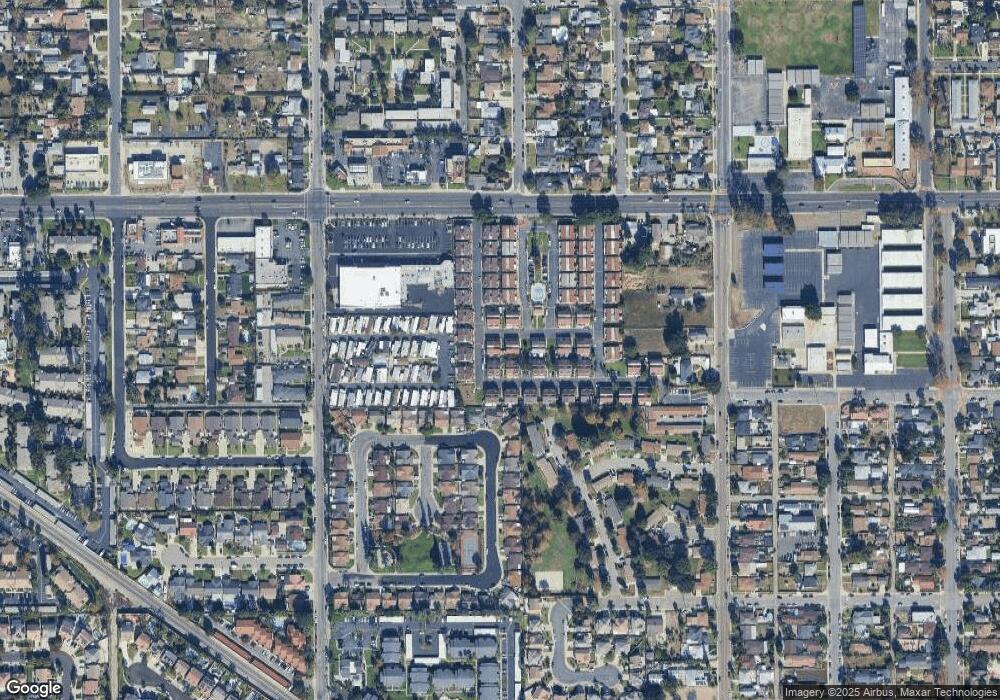
Map
Nearby Homes
- 13065 San Clemente Ln
- 13079 Monte Vista Ave
- 13123 2nd St
- 12931 4th St
- 12629 Thomas Place
- 13239 2nd St
- 13148 Derby Ave
- 12585 Yorba Ave
- 13257 2nd St
- 12620 Anthony Place
- 13085 5th St
- 4621 Chino Ave
- 5039 Tyler St
- 12608 Ramona Ave
- 12488 Monte Vista Ave
- 4912 G St
- 4372 Rainier Ct
- 4836 Terry Ave
- 4457 Heather Cir
- 5195 Walnut Ave Unit 14
- 4813 Ranch Rd
- 4805 Ranch Rd
- 4817 Ranch Rd
- 4816 Southfork Rd
- 4812 Southfork Rd
- 4801 Ranch Rd
- 4821 Ranch Rd
- 4808 Southfork Rd
- 4810 Ranch Rd
- 4820 Southfork Rd
- 4806 Ranch Rd
- 4804 Southfork Rd
- 4824 Southfork Rd
- 4802 Ranch Rd
- 12958 Royal Palm Cir
- 4825 Ranch Rd
- 4815 Southfork Rd
- 12978 Homestead Place
- 12974 Homestead Place
- 12957 Homestead Place
Your Personal Tour Guide
Ask me questions while you tour the home.