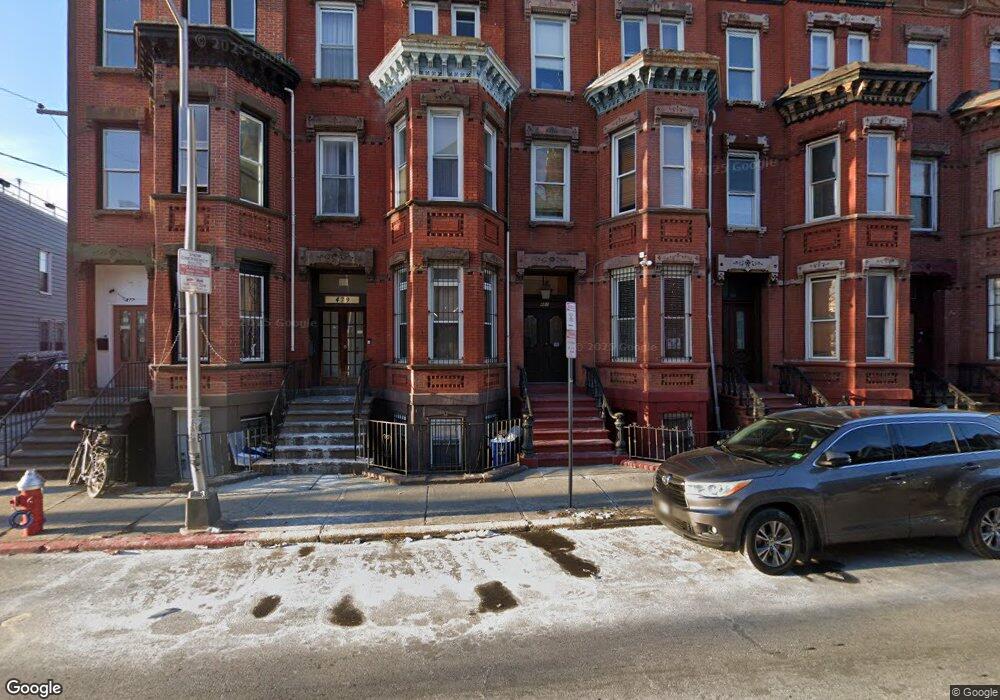
481 Bergen Ave Unit 2 Jersey City, NJ 07304
West Side NeighborhoodEstimated Value: $702,541 - $1,076,000
2
Beds
2
Baths
1,800
Sq Ft
$473/Sq Ft
Est. Value
About This Home
This home is located at 481 Bergen Ave Unit 2, Jersey City, NJ 07304 and is currently estimated at $850,885, approximately $472 per square foot. 481 Bergen Ave Unit 2 is a home located in Hudson County with nearby schools including Chaplain Charles Watters School, PS #24, Lincoln High School, and Henry Snyder High School.
Ownership History
Date
Name
Owned For
Owner Type
Purchase Details
Closed on
Apr 7, 2016
Sold by
Equity Trust Company Fbo R James
Bought by
Midland Ira Inc Fbo Reginald James
Current Estimated Value
Purchase Details
Closed on
Sep 30, 2009
Sold by
Us Bank N A
Bought by
Equity Trust Company Custodian Fbo
Purchase Details
Closed on
Jan 23, 2004
Sold by
Chohan Haroon
Bought by
Farmer Robert
Home Financials for this Owner
Home Financials are based on the most recent Mortgage that was taken out on this home.
Original Mortgage
$369,075
Interest Rate
6.15%
Mortgage Type
Purchase Money Mortgage
Purchase Details
Closed on
Oct 7, 2002
Sold by
Williams Sonya and Manning Arlene
Bought by
Chen Buu Kao
Purchase Details
Closed on
Jul 24, 1996
Sold by
Hairston Rodney and Hairston Deborah W
Bought by
Williams Sonya and Manning Arlene
Home Financials for this Owner
Home Financials are based on the most recent Mortgage that was taken out on this home.
Original Mortgage
$56,250
Interest Rate
8.24%
Create a Home Valuation Report for This Property
The Home Valuation Report is an in-depth analysis detailing your home's value as well as a comparison with similar homes in the area
Home Values in the Area
Average Home Value in this Area
Purchase History
| Date | Buyer | Sale Price | Title Company |
|---|---|---|---|
| Midland Ira Inc Fbo Reginald James | -- | -- | |
| Equity Trust Company Custodian Fbo | $110,000 | -- | |
| Farmer Robert | $388,500 | -- | |
| Chen Buu Kao | $50,000 | -- | |
| Williams Sonya | $75,000 | -- |
Source: Public Records
Mortgage History
| Date | Status | Borrower | Loan Amount |
|---|---|---|---|
| Previous Owner | Farmer Robert | $369,075 | |
| Previous Owner | Williams Sonya | $56,250 |
Source: Public Records
Tax History Compared to Growth
Tax History
| Year | Tax Paid | Tax Assessment Tax Assessment Total Assessment is a certain percentage of the fair market value that is determined by local assessors to be the total taxable value of land and additions on the property. | Land | Improvement |
|---|---|---|---|---|
| 2025 | $10,620 | $475,600 | $78,500 | $397,100 |
| 2024 | $10,687 | $475,600 | $78,500 | $397,100 |
| 2023 | $10,687 | $475,600 | $78,500 | $397,100 |
| 2022 | $10,073 | $475,600 | $78,500 | $397,100 |
| 2021 | $7,629 | $475,600 | $78,500 | $397,100 |
| 2020 | $7,657 | $475,600 | $78,500 | $397,100 |
| 2019 | $7,324 | $475,600 | $78,500 | $397,100 |
| 2018 | $1,528 | $475,600 | $78,500 | $397,100 |
| 2017 | $8,011 | $102,700 | $4,000 | $98,700 |
| 2016 | $7,909 | $102,700 | $4,000 | $98,700 |
| 2015 | $7,635 | $124,700 | $4,000 | $120,700 |
| 2014 | $9,270 | $124,700 | $4,000 | $120,700 |
Source: Public Records
Map
Nearby Homes
- 111 Clinton Ave
- 94 Clinton Ave
- 121 Clinton Ave
- 628 Bramhall Ave
- 64,66,68-70 Sackett St
- 30 Lexington Ave
- 62 Sackett St
- 608 Bramhall Ave Unit 1D/104
- 31 Lexington Ave
- 35 Lexington Ave
- 596 Bramhall Ave
- 68 Lexington Ave
- 117 Atlantic St
- 223 Harrison Ave Unit 2
- 223 Harrison Ave
- 585 Bramhall Ave
- 74 Atlantic St
- 583 Bramhall Ave
- 63 Brinkerhoff St
- 540 Martin Luther King Dr
- 481 Bergen Ave
- 479 Bergen Ave
- 483 Bergen Ave
- 477 Bergen Ave
- 485 Bergen Ave
- 485 Bergen Ave Unit 2
- 485 Bergen Ave Unit 3
- 487 Bergen Ave
- 139 Clinton Ave
- 475 Bergen Ave
- 473 Bergen Ave
- 473 Bergen Ave
- 473 Bergen Ave Unit G
- 473 Bergen Ave Unit 1
- 473 Bergen Ave Unit 2
- 34 Oxford Ave
- 141 Clinton Ave
- 471 Bergen Ave
- 478 Bergen Ave
- 145 Clinton Ave Unit 7