481 E Maple St Morrison, TN 37357
Estimated Value: $193,904 - $301,000
Studio
2
Baths
1,690
Sq Ft
$147/Sq Ft
Est. Value
About This Home
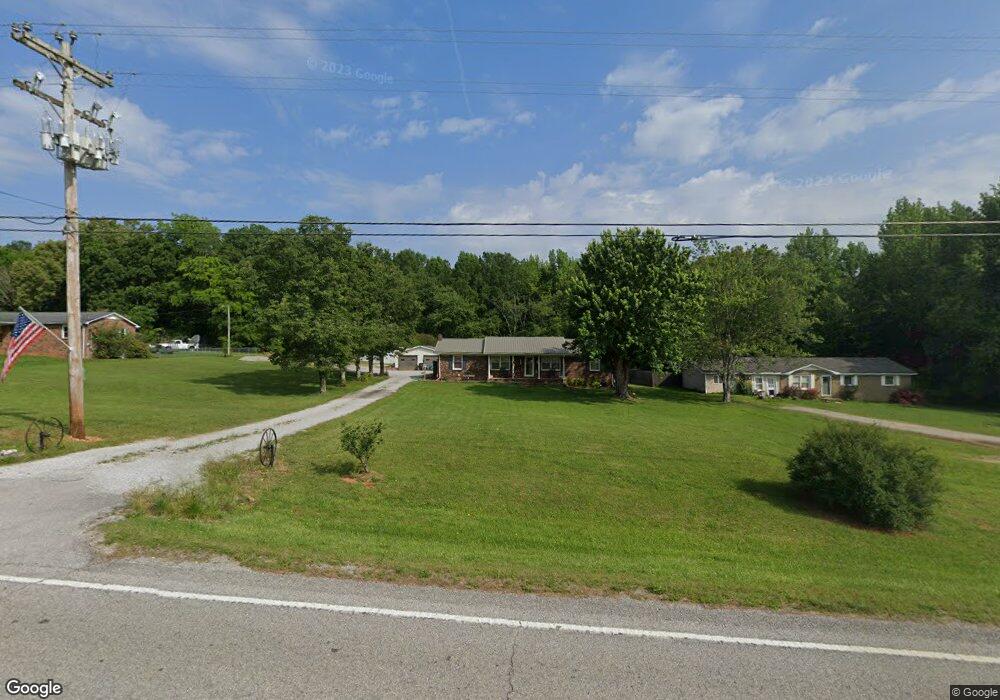
This home is located at 481 E Maple St, Morrison, TN 37357 and is currently estimated at $248,476, approximately $147 per square foot. 481 E Maple St is a home located in Warren County with nearby schools including Morrison Elementary School and Warren County High School.
Ownership History
Date
Name
Owned For
Owner Type
Purchase Details
Closed on
Apr 7, 1989
Bought by
Muncey Steve Allen and Muncey Retha A
Current Estimated Value
Purchase Details
Closed on
Jan 12, 1977
Bought by
Jennings David and Jennings Helen
Purchase Details
Closed on
Jan 2, 1900
Create a Home Valuation Report for This Property
The Home Valuation Report is an in-depth analysis detailing your home's value as well as a comparison with similar homes in the area
Purchase History
| Date | Buyer | Sale Price | Title Company |
|---|---|---|---|
| Muncey Steve Allen | $56,000 | -- | |
| Jennings David | -- | -- | |
| -- | -- | -- |
Source: Public Records
Tax History
| Year | Tax Paid | Tax Assessment Tax Assessment Total Assessment is a certain percentage of the fair market value that is determined by local assessors to be the total taxable value of land and additions on the property. | Land | Improvement |
|---|---|---|---|---|
| 2025 | -- | $50,775 | $8,950 | $41,825 |
| 2024 | -- | $31,475 | $3,450 | $28,025 |
| 2023 | $651 | $31,475 | $3,450 | $28,025 |
| 2022 | $651 | $31,475 | $3,450 | $28,025 |
| 2021 | $651 | $31,475 | $3,450 | $28,025 |
| 2020 | $539 | $31,475 | $3,450 | $28,025 |
| 2019 | $611 | $25,900 | $2,500 | $23,400 |
| 2018 | $538 | $25,900 | $2,500 | $23,400 |
| 2017 | $538 | $25,900 | $2,500 | $23,400 |
| 2016 | $509 | $25,900 | $2,500 | $23,400 |
| 2015 | $546 | $25,900 | $2,500 | $23,400 |
| 2014 | $495 | $25,900 | $2,500 | $23,400 |
| 2013 | $495 | $23,485 | $0 | $0 |
Source: Public Records
Map
Nearby Homes
- 120 Boyd St
- 431 S Fair St
- 511 N Main St
- 101 S Mill St
- 8557 Manchester Hwy
- 631 W Maple St
- 2357 Beacon Light Rd Unit 1
- 2100 Beacon Light Rd Unit 6
- 2100 Beacon Light Rd Unit 4
- 2100 Beacon Light Rd Unit 8
- 2100 Beacon Light Rd
- 2100 Beacon Light Rd Unit 9
- 2357 Beacon Light Rd
- 2100 Beacon Light Rd Unit 3
- 2100 Beacon Light Rd Unit 11
- 2100 Beacon Light Rd Unit 5
- 2100 Beacon Light Rd Unit 10
- 2100 Beacon Light Rd Unit 7
- 2100 Beacon Light Rd Unit 2
- 0 Old Wells Rd
- 471 E Maple St
- 491 E Maple St
- 461 E Maple St
- 451 E Maple St
- 460 E Maple St
- 441 E Maple St
- Lot #94 Windswept Way
- 431 E Maple St
- 440 E Maple St
- 2 Manchester Hwy
- 1 Manchester Hwy
- 9800 Manchester Hwy
- 421 E Maple St
- 420 E Maple St
- 411 E Maple St
- 391 Pendleton Rd
- 361 E Maple St
- 380 Pendleton Rd
- 0 Hervy Jones Rd
Your Personal Tour Guide
Ask me questions while you tour the home.