Estimated Value: $702,641 - $782,000
5
Beds
2
Baths
2,536
Sq Ft
$298/Sq Ft
Est. Value
About This Home
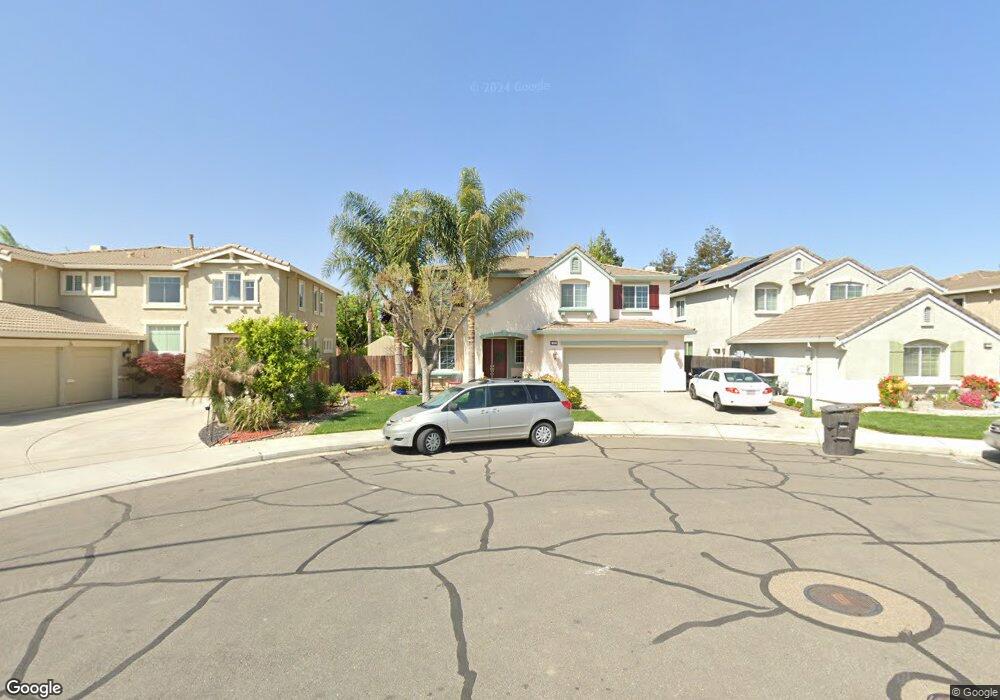
This home is located at 481 Mesa Ct, Tracy, CA 95377 and is currently estimated at $754,660, approximately $297 per square foot. 481 Mesa Ct is a home located in San Joaquin County with nearby schools including George Kelly Elementary School, John C. Kimball High School, and Tracy Independent Study Charter School.
Ownership History
Date
Name
Owned For
Owner Type
Purchase Details
Closed on
Jun 17, 2024
Sold by
Wahhab Akram and Nguyen Tuyet T
Bought by
Wahhab Nguyen Family Trust and Wahhab
Current Estimated Value
Purchase Details
Closed on
Jan 28, 2009
Sold by
American Home Mortgage
Bought by
Wahhab Akram and Nguyen Tuyet T
Home Financials for this Owner
Home Financials are based on the most recent Mortgage that was taken out on this home.
Original Mortgage
$236,000
Interest Rate
5.08%
Mortgage Type
Purchase Money Mortgage
Purchase Details
Closed on
Mar 28, 2008
Sold by
Duarte Joseph and Duarte Kathleen
Bought by
American Home Mortgage
Purchase Details
Closed on
Oct 13, 2003
Sold by
Meritage Homes Of Northern California In
Bought by
Duarte Joseph and Duarte Kathleen
Home Financials for this Owner
Home Financials are based on the most recent Mortgage that was taken out on this home.
Original Mortgage
$322,700
Interest Rate
6.14%
Mortgage Type
Purchase Money Mortgage
Create a Home Valuation Report for This Property
The Home Valuation Report is an in-depth analysis detailing your home's value as well as a comparison with similar homes in the area
Home Values in the Area
Average Home Value in this Area
Purchase History
| Date | Buyer | Sale Price | Title Company |
|---|---|---|---|
| Wahhab Nguyen Family Trust | -- | None Listed On Document | |
| Wahhab Akram | $295,000 | First American Title | |
| American Home Mortgage | $491,991 | Accommodation | |
| Duarte Joseph | $404,000 | North American Title Co |
Source: Public Records
Mortgage History
| Date | Status | Borrower | Loan Amount |
|---|---|---|---|
| Previous Owner | Wahhab Akram | $236,000 | |
| Previous Owner | Duarte Joseph | $322,700 |
Source: Public Records
Tax History
| Year | Tax Paid | Tax Assessment Tax Assessment Total Assessment is a certain percentage of the fair market value that is determined by local assessors to be the total taxable value of land and additions on the property. | Land | Improvement |
|---|---|---|---|---|
| 2025 | $5,752 | $379,868 | $93,998 | $285,870 |
| 2024 | $5,371 | $372,420 | $92,155 | $280,265 |
| 2023 | $5,275 | $365,119 | $90,349 | $274,770 |
| 2022 | $5,437 | $357,961 | $88,578 | $269,383 |
| 2021 | $5,345 | $350,943 | $86,842 | $264,101 |
| 2020 | $5,290 | $347,345 | $85,952 | $261,393 |
| 2019 | $5,198 | $340,535 | $84,267 | $256,268 |
| 2018 | $5,090 | $333,859 | $82,615 | $251,244 |
| 2017 | $4,878 | $327,314 | $80,996 | $246,318 |
| 2016 | $4,893 | $320,898 | $79,409 | $241,489 |
| 2014 | $4,623 | $309,892 | $76,685 | $233,207 |
Source: Public Records
Map
Nearby Homes
- 2432 Tennis Ln
- 2431 Garrett Ct
- 2325 Alamo Ct
- 2219 Yellowstone Ave
- 2132 Tennis Ln
- 2689 Jackson Ave
- 2403 Clemente Ln
- 1990 Harvest Landing Ct
- 230 Steven Bridges Ln
- 2248 Golden Leaf Ln
- 8300 W 11th St
- 2280 Gibralter Ln
- 1233 Plaza Ct
- 2271 Robert Gabriel Dr
- 2921 Compton Place
- 2488 Gaines Ln
- 573 Veneto Ct
- 2431 Ogden Sannazor Ct
- 723 Ann Gabriel Ln
- 2228 Carol Ann Dr
Your Personal Tour Guide
Ask me questions while you tour the home.