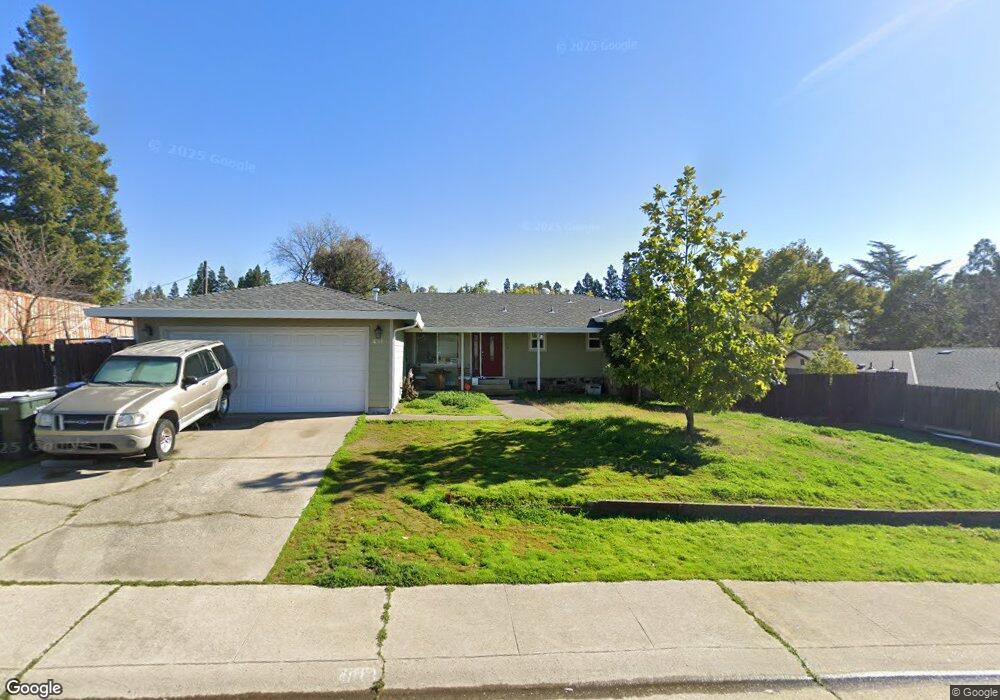
4810 Hartman Way Fair Oaks, CA 95628
Estimated Value: $555,000 - $615,000
3
Beds
2
Baths
1,538
Sq Ft
$382/Sq Ft
Est. Value
About This Home
This home is located at 4810 Hartman Way, Fair Oaks, CA 95628 and is currently estimated at $587,527, approximately $382 per square foot. 4810 Hartman Way is a home located in Sacramento County with nearby schools including Earl Legette Elementary School, Andrew Carnegie Middle School, and Bella Vista High School.
Ownership History
Date
Name
Owned For
Owner Type
Purchase Details
Closed on
Aug 3, 2011
Sold by
Budworth Marsha N
Bought by
Budworth Marsha N and Budworth Family Trust
Current Estimated Value
Purchase Details
Closed on
Aug 2, 2011
Sold by
Sweeney Robin Annette
Bought by
Budworth Marsha N
Purchase Details
Closed on
Dec 8, 2008
Sold by
Deutsche Bank National Trust Company
Bought by
Sweeney Robin Annette
Purchase Details
Closed on
Oct 29, 2008
Sold by
Heming Thomas
Bought by
Deutsche Bank National Trust Company
Purchase Details
Closed on
Nov 12, 2003
Sold by
Brown James D and Brown Deborah S
Bought by
Heming Thomas
Home Financials for this Owner
Home Financials are based on the most recent Mortgage that was taken out on this home.
Original Mortgage
$239,960
Interest Rate
6.13%
Mortgage Type
Purchase Money Mortgage
Create a Home Valuation Report for This Property
The Home Valuation Report is an in-depth analysis detailing your home's value as well as a comparison with similar homes in the area
Home Values in the Area
Average Home Value in this Area
Purchase History
| Date | Buyer | Sale Price | Title Company |
|---|---|---|---|
| Budworth Marsha N | -- | Fidelity National Title Co | |
| Budworth Marsha N | $225,000 | Fidelity National Title Co | |
| Sweeney Robin Annette | $205,000 | First American Title Company | |
| Deutsche Bank National Trust Company | $202,500 | North American Title Company | |
| Heming Thomas | $300,000 | Commonwealth Land Title Co |
Source: Public Records
Mortgage History
| Date | Status | Borrower | Loan Amount |
|---|---|---|---|
| Previous Owner | Heming Thomas | $239,960 | |
| Closed | Heming Thomas | $59,990 |
Source: Public Records
Tax History Compared to Growth
Tax History
| Year | Tax Paid | Tax Assessment Tax Assessment Total Assessment is a certain percentage of the fair market value that is determined by local assessors to be the total taxable value of land and additions on the property. | Land | Improvement |
|---|---|---|---|---|
| 2025 | $3,438 | $282,601 | $182,123 | $100,478 |
| 2024 | $3,438 | $277,060 | $178,552 | $98,508 |
| 2023 | $3,338 | $271,628 | $175,051 | $96,577 |
| 2022 | $3,325 | $266,303 | $171,619 | $94,684 |
| 2021 | $3,261 | $261,082 | $168,254 | $92,828 |
| 2020 | $3,214 | $258,406 | $166,529 | $91,877 |
| 2019 | $3,133 | $253,340 | $163,264 | $90,076 |
| 2018 | $3,064 | $248,373 | $160,063 | $88,310 |
| 2017 | $3,033 | $243,504 | $156,925 | $86,579 |
| 2016 | $2,835 | $238,731 | $153,849 | $84,882 |
| 2015 | $2,786 | $235,146 | $151,539 | $83,607 |
| 2014 | $2,728 | $230,541 | $148,571 | $81,970 |
Source: Public Records
Map
Nearby Homes
- 8879 Sunset Ave
- 8830 Barrister Ln
- 4926 Arbardee Dr
- 4820 Sanford St
- 8890 N Winding Way
- 8801 Villa Campo Way
- 8909 La Serena Dr
- 0 Illinois Ave Unit 225121990
- 5040 Havelok St
- 8909 Ramstad Ave
- 8954 Phoenix Ave
- 5221 Tucson Cir
- 9085 Hangar Way
- 8808 Chandeaux Ln
- 8752 Winding Way
- 8593 Sunset Ave
- 9065 Approach Ct
- 9101 Sunset Ave
- 9017 Phoenix Ave
- 8739 Noland Ln
- 4830 Hartman Way
- 4800 Hartman Way
- 8875 Sunset Ave
- 4840 Hartman Way
- 4811 Hartman Way
- 4821 Hartman Way
- 8845 Sunset Ave
- 4850 Hartman Way
- 4827 Hartman Way
- 4837 Hartman Way
- 8879 Sunset Ave Unit Main House
- 8833 Sunset Ave
- 4843 Hartman Way
- 8831 Sunset Ave
- 4831 Hartman Way
- 8856 Sunset Ave
- 4849 Hartman Way
- 8878 Sunset Ave
- 8817 Sunset Ave
- 8880 Sunset Ave