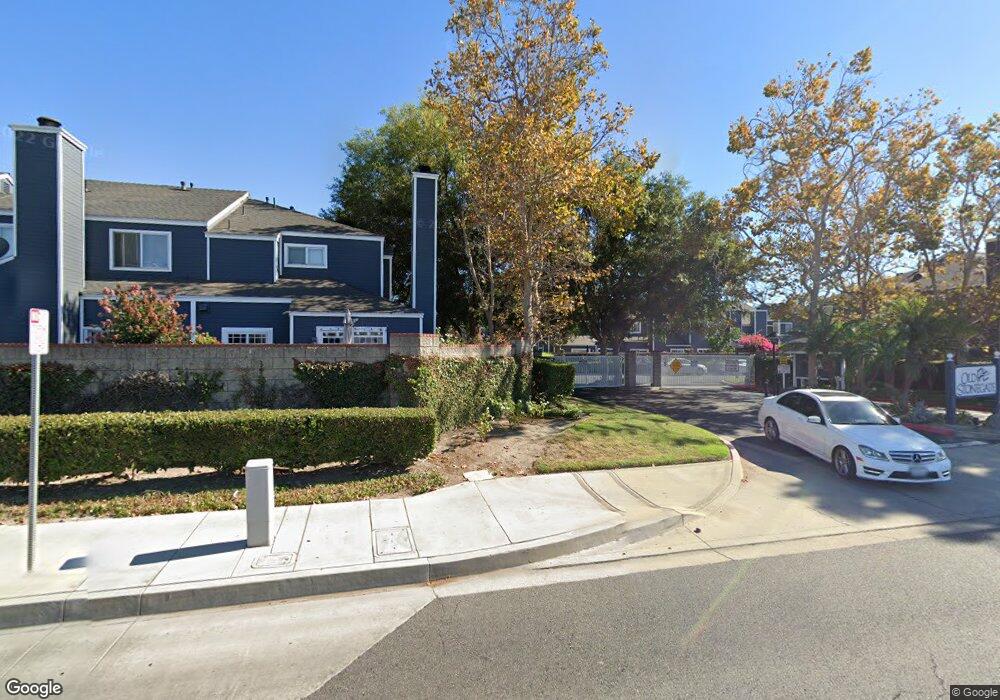
4812 Irongate Ln Santa Ana, CA 92703
Riverview West NeighborhoodEstimated Value: $736,000 - $847,000
3
Beds
3
Baths
1,281
Sq Ft
$618/Sq Ft
Est. Value
About This Home
This home is located at 4812 Irongate Ln, Santa Ana, CA 92703 and is currently estimated at $791,375, approximately $617 per square foot. 4812 Irongate Ln is a home located in Orange County with nearby schools including Woodbury Elementary School, James Irvine Intermediate School, and Bolsa Grande High School.
Ownership History
Date
Name
Owned For
Owner Type
Purchase Details
Closed on
Jan 20, 2024
Sold by
Lam Hai Ngoc and Nguyen Minhtam Thi
Bought by
Hai Ngoc Lam & Minhtam Thi Nguyen Revocable L and Lam
Current Estimated Value
Purchase Details
Closed on
Feb 19, 2013
Sold by
Lam Hai N and Nguyen Mintam T
Bought by
Lam Hai N and Nguyen Minhtam T
Home Financials for this Owner
Home Financials are based on the most recent Mortgage that was taken out on this home.
Original Mortgage
$100,000
Interest Rate
3.49%
Mortgage Type
New Conventional
Purchase Details
Closed on
Jun 30, 1994
Sold by
Metrokas Gordon S and Metroka Margaret D
Bought by
Lam Hai N and Nguyen Mintam T
Home Financials for this Owner
Home Financials are based on the most recent Mortgage that was taken out on this home.
Original Mortgage
$110,360
Interest Rate
8.57%
Create a Home Valuation Report for This Property
The Home Valuation Report is an in-depth analysis detailing your home's value as well as a comparison with similar homes in the area
Home Values in the Area
Average Home Value in this Area
Purchase History
| Date | Buyer | Sale Price | Title Company |
|---|---|---|---|
| Hai Ngoc Lam & Minhtam Thi Nguyen Revocable L | -- | None Listed On Document | |
| Lam Hai N | -- | Wfg Title Insurance Company | |
| Lam Hai N | $124,000 | Old Republic Title Company |
Source: Public Records
Mortgage History
| Date | Status | Borrower | Loan Amount |
|---|---|---|---|
| Previous Owner | Lam Hai N | $100,000 | |
| Previous Owner | Lam Hai N | $110,360 |
Source: Public Records
Tax History Compared to Growth
Tax History
| Year | Tax Paid | Tax Assessment Tax Assessment Total Assessment is a certain percentage of the fair market value that is determined by local assessors to be the total taxable value of land and additions on the property. | Land | Improvement |
|---|---|---|---|---|
| 2025 | $2,585 | $208,268 | $63,746 | $144,522 |
| 2024 | $2,585 | $204,185 | $62,496 | $141,689 |
| 2023 | $2,533 | $200,182 | $61,271 | $138,911 |
| 2022 | $2,473 | $196,257 | $60,069 | $136,188 |
| 2021 | $2,438 | $192,409 | $58,891 | $133,518 |
| 2020 | $2,408 | $190,437 | $58,288 | $132,149 |
| 2019 | $2,377 | $186,703 | $57,145 | $129,558 |
| 2018 | $2,319 | $183,043 | $56,025 | $127,018 |
| 2017 | $2,294 | $179,454 | $54,926 | $124,528 |
| 2016 | $2,198 | $175,936 | $53,849 | $122,087 |
| 2015 | $2,168 | $173,294 | $53,040 | $120,254 |
| 2014 | $2,116 | $169,900 | $52,001 | $117,899 |
Source: Public Records
Map
Nearby Homes
- 1609 N Parsons Place
- 11321 Parkgreen Ln Unit 102
- 13322 Euclid St
- 1114 N Gates St
- 10886 Lotus Dr
- 13611 Glenhaven Dr
- 14356 Taft St
- 526 W Tribella Ct
- 14151 Lake St
- 4201 W 5th St Unit 314
- 5317 Silver Dr
- 4832 W 5th St Unit B
- 4248 W 5th St
- 1314 N Bewley St
- 323 N Euclid St Unit 99
- 5405 W 4th St
- 3625 W 11th St
- 3929 W 5th St Unit 16
- 3932 W 5th St Unit 202
- 13312 Michael Rainford Cir
- 4814 Irongate Ln
- 4810 Irongate Ln
- 4818 Irongate Ln
- 1606 Haven Ln
- 1610 Haven Ln
- 1608 Haven Ln
- 1612 Haven Ln
- 1604 Haven Ln
- 4820 Irongate Ln
- 1602 Haven Ln
- 4813 Irongate Ln
- 4811 Irongate Ln
- 4815 Irongate Ln
- 4817 Irongate Ln
- 4822 Irongate Ln
- 1522 Haven Ln
- 4819 Irongate Ln
- 4821 Irongate Ln
- 1520 Haven Ln
- 4824 Irongate Ln