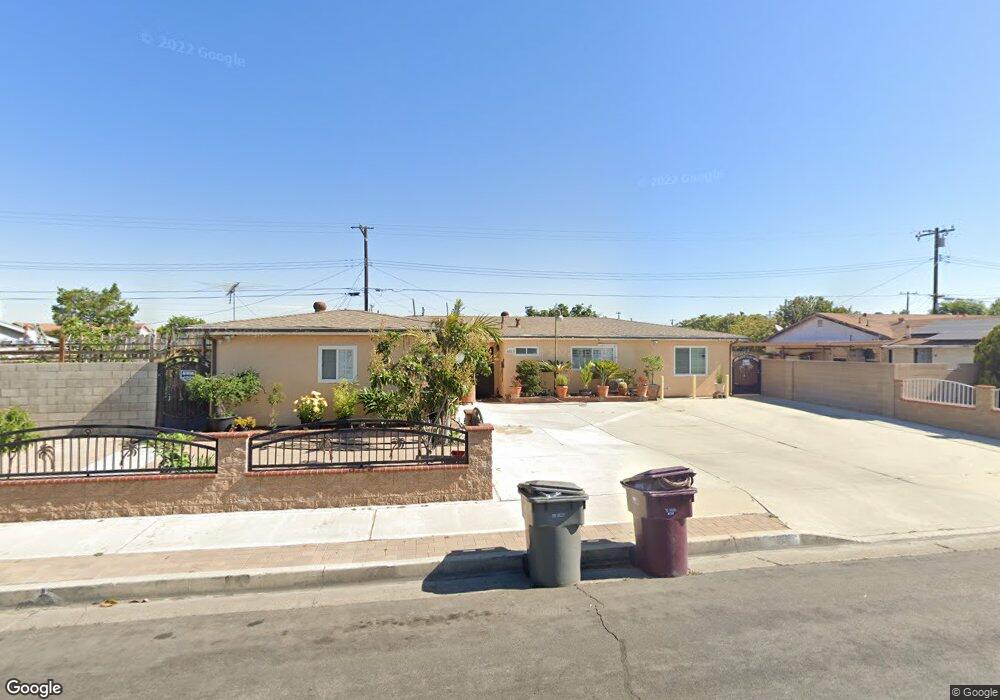
4813 Bruce Ave Santa Ana, CA 92703
Riverview West NeighborhoodEstimated Value: $882,000 - $1,001,000
4
Beds
3
Baths
1,780
Sq Ft
$544/Sq Ft
Est. Value
About This Home
This home is located at 4813 Bruce Ave, Santa Ana, CA 92703 and is currently estimated at $967,632, approximately $543 per square foot. 4813 Bruce Ave is a home located in Orange County with nearby schools including Rosita Elementary School, James Irvine Intermediate School, and Bolsa Grande High School.
Ownership History
Date
Name
Owned For
Owner Type
Purchase Details
Closed on
Feb 3, 2015
Sold by
Nguyen Hung Manh
Bought by
Nguyen Hung Manh and Ly Tuyet Anh
Current Estimated Value
Home Financials for this Owner
Home Financials are based on the most recent Mortgage that was taken out on this home.
Original Mortgage
$271,000
Interest Rate
3.76%
Mortgage Type
New Conventional
Purchase Details
Closed on
Aug 12, 2008
Sold by
Nguyen Hung Manh
Bought by
Nguyen Hung Manh
Purchase Details
Closed on
Oct 3, 2005
Sold by
Nguyen Mandy Tran
Bought by
Nguyen Hung Manh
Home Financials for this Owner
Home Financials are based on the most recent Mortgage that was taken out on this home.
Original Mortgage
$300,000
Interest Rate
5%
Mortgage Type
Purchase Money Mortgage
Purchase Details
Closed on
Aug 14, 2003
Sold by
Nguyen Mary To
Bought by
Nguyen Hung Manh
Purchase Details
Closed on
Jul 24, 2002
Sold by
Nguyen Hung Manh
Bought by
Nguyen Mary To
Create a Home Valuation Report for This Property
The Home Valuation Report is an in-depth analysis detailing your home's value as well as a comparison with similar homes in the area
Home Values in the Area
Average Home Value in this Area
Purchase History
| Date | Buyer | Sale Price | Title Company |
|---|---|---|---|
| Nguyen Hung Manh | -- | First American Title Company | |
| Nguyen Hung Manh | -- | None Available | |
| Nguyen Hung Manh | -- | Fidelity National Title | |
| Nguyen Hung Manh | -- | -- | |
| Nguyen Mary To | -- | -- |
Source: Public Records
Mortgage History
| Date | Status | Borrower | Loan Amount |
|---|---|---|---|
| Closed | Nguyen Hung Manh | $271,000 | |
| Closed | Nguyen Hung Manh | $300,000 |
Source: Public Records
Tax History Compared to Growth
Tax History
| Year | Tax Paid | Tax Assessment Tax Assessment Total Assessment is a certain percentage of the fair market value that is determined by local assessors to be the total taxable value of land and additions on the property. | Land | Improvement |
|---|---|---|---|---|
| 2025 | $6,497 | $566,674 | $431,235 | $135,439 |
| 2024 | $6,497 | $555,563 | $422,779 | $132,784 |
| 2023 | $6,378 | $544,670 | $414,489 | $130,181 |
| 2022 | $6,234 | $533,991 | $406,362 | $127,629 |
| 2021 | $6,148 | $523,521 | $398,394 | $125,127 |
| 2020 | $6,073 | $518,153 | $394,309 | $123,844 |
| 2019 | $5,990 | $507,994 | $386,578 | $121,416 |
| 2018 | $5,839 | $498,034 | $378,998 | $119,036 |
| 2017 | $5,781 | $488,269 | $371,567 | $116,702 |
| 2016 | $5,522 | $478,696 | $364,282 | $114,414 |
| 2015 | $4,817 | $414,047 | $358,810 | $55,237 |
| 2014 | $4,702 | $405,937 | $351,782 | $54,155 |
Source: Public Records
Map
Nearby Homes
- 13322 Euclid St
- 1609 N Parsons Place
- 11321 Parkgreen Ln Unit 102
- 10886 Lotus Dr
- 1114 N Gates St
- 14356 Taft St
- 5317 Silver Dr
- 4832 W 5th St Unit B
- 4201 W 5th St Unit 314
- 323 N Euclid St Unit 99
- 4248 W 5th St
- 5405 W 4th St
- 526 W Tribella Ct
- 14151 Lake St
- 3929 W 5th St Unit 16
- 3932 W 5th St Unit 202
- 4518 W 1st St
- 13611 Glenhaven Dr
- 5114 W 1st St Unit C
- 5112 W 1st St Unit C
- 4801 Bruce Ave
- 4817 Bruce Ave
- 4810 W Maurie Ave
- 4818 W Maurie Ave
- 4806 W Maurie Ave
- 4806 Bruce Ave
- 4814 Bruce Ave
- 4822 W Maurie Ave
- 4821 Bruce Ave
- 4721 Bruce Ave
- 4818 Bruce Ave
- 4802 Bruce Ave
- 4722 Bruce Ave
- 4822 Bruce Ave
- 4902 W Maurie Ave
- 4809 Oakfield Ave
- 4817 W Maurie Ave
- 4809 W Maurie Ave
- 4901 Bruce Ave
- 4817 Oakfield Ave