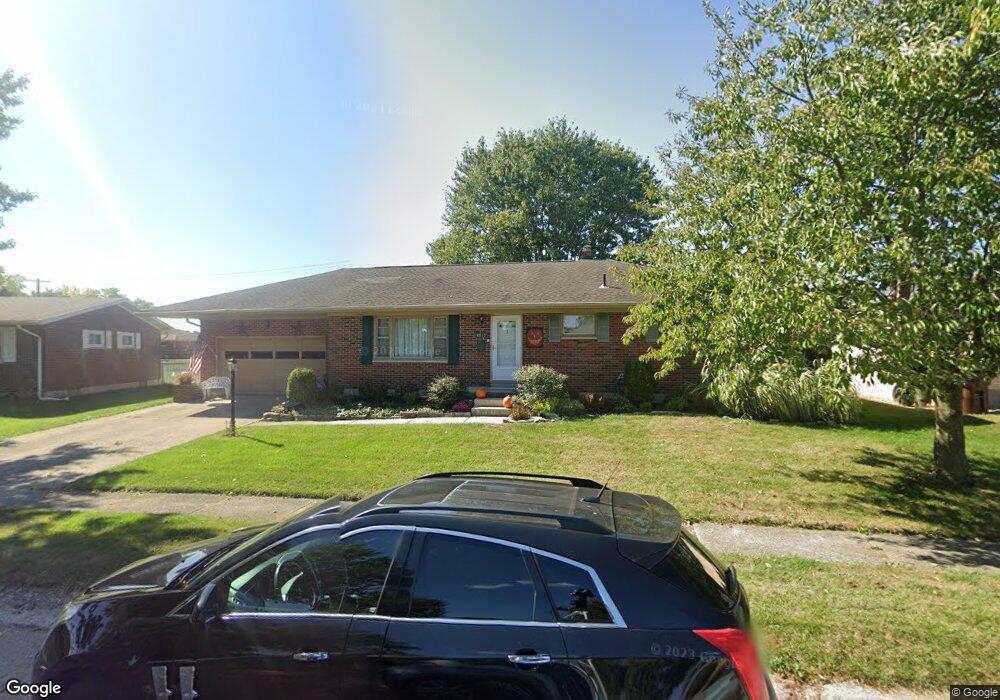
4815 Gay St Springfield, OH 45503
Estimated Value: $221,000 - $225,000
3
Beds
1
Bath
1,305
Sq Ft
$171/Sq Ft
Est. Value
About This Home
This home is located at 4815 Gay St, Springfield, OH 45503 and is currently estimated at $223,424, approximately $171 per square foot. 4815 Gay St is a home located in Clark County with nearby schools including Rolling Hills Elementary School, Northridge Elementary School, and Northridge Middle School.
Ownership History
Date
Name
Owned For
Owner Type
Purchase Details
Closed on
Dec 20, 2010
Sold by
Vanarsdall Charles E and Vanarsdall Mary Linda
Bought by
4815 Gay Street Llc
Current Estimated Value
Purchase Details
Closed on
Oct 1, 2010
Sold by
Fannie Mae
Bought by
Vanarsdall Charles E and Vanarsdall Mary Linda
Home Financials for this Owner
Home Financials are based on the most recent Mortgage that was taken out on this home.
Original Mortgage
$65,625
Interest Rate
4.22%
Mortgage Type
New Conventional
Purchase Details
Closed on
Jul 12, 2010
Sold by
Davis Thomas J
Bought by
Federal National Mortgage Association
Purchase Details
Closed on
Aug 10, 2000
Sold by
Bogard Mildred L Trustee and Yvonne
Bought by
Davis Thomas J and Davis Debbie S
Home Financials for this Owner
Home Financials are based on the most recent Mortgage that was taken out on this home.
Original Mortgage
$92,150
Interest Rate
8.24%
Mortgage Type
Purchase Money Mortgage
Create a Home Valuation Report for This Property
The Home Valuation Report is an in-depth analysis detailing your home's value as well as a comparison with similar homes in the area
Home Values in the Area
Average Home Value in this Area
Purchase History
| Date | Buyer | Sale Price | Title Company |
|---|---|---|---|
| 4815 Gay Street Llc | -- | Attorney | |
| Vanarsdall Charles E | $87,500 | None Available | |
| Federal National Mortgage Association | $66,700 | None Available | |
| Davis Thomas J | $97,000 | -- |
Source: Public Records
Mortgage History
| Date | Status | Borrower | Loan Amount |
|---|---|---|---|
| Previous Owner | Vanarsdall Charles E | $65,625 | |
| Previous Owner | Davis Thomas J | $92,150 |
Source: Public Records
Tax History Compared to Growth
Tax History
| Year | Tax Paid | Tax Assessment Tax Assessment Total Assessment is a certain percentage of the fair market value that is determined by local assessors to be the total taxable value of land and additions on the property. | Land | Improvement |
|---|---|---|---|---|
| 2024 | $2,050 | $47,410 | $10,130 | $37,280 |
| 2023 | $2,050 | $47,410 | $10,130 | $37,280 |
| 2022 | $2,058 | $47,410 | $10,130 | $37,280 |
| 2021 | $2,087 | $40,740 | $8,040 | $32,700 |
| 2020 | $2,089 | $40,740 | $8,040 | $32,700 |
| 2019 | $2,129 | $40,740 | $8,040 | $32,700 |
| 2018 | $1,912 | $35,100 | $7,210 | $27,890 |
| 2017 | $1,645 | $35,774 | $7,207 | $28,567 |
| 2016 | $1,634 | $35,774 | $7,207 | $28,567 |
| 2015 | $1,664 | $33,852 | $6,930 | $26,922 |
| 2014 | $1,664 | $33,852 | $6,930 | $26,922 |
| 2013 | $1,626 | $33,852 | $6,930 | $26,922 |
Source: Public Records
Map
Nearby Homes
- 4800 Mesa Ln
- 4849 Ashley Dr
- 4740 Merrimont Ave
- 1709 Thomas Dr
- 4620 Eldora St
- 4620 Eldora Dr
- 4825 Chippendale Dr
- 4524 Ridgewood Rd E
- 1835 Sierra Ave
- 4512 Ridgewood Rd E
- 4644 Middle Urbana Rd
- 4924 Brannan Dr E Unit 4924
- 5127 Stoneridge Dr
- 4438 Tacoma St
- 4321 Tulane Rd
- 4316 Phoenix Dr
- 4622 W Ridgewood Rd
- 5249 Taywell Dr