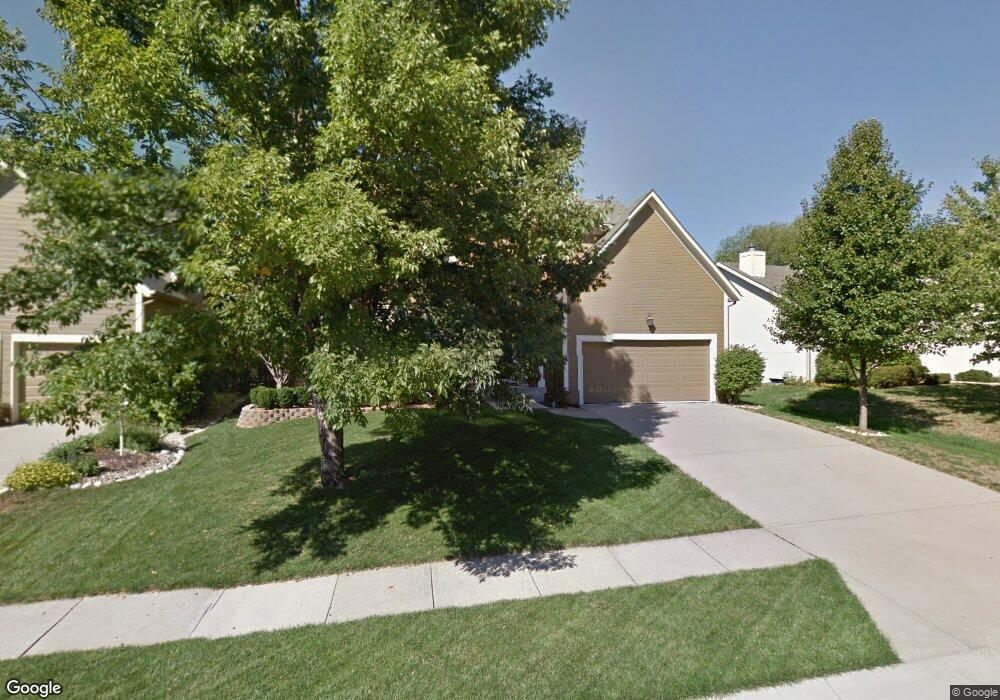
4816 Millridge St Shawnee, KS 66226
Estimated Value: $429,997 - $452,000
4
Beds
4
Baths
2,050
Sq Ft
$217/Sq Ft
Est. Value
About This Home
This home is located at 4816 Millridge St, Shawnee, KS 66226 and is currently estimated at $444,749, approximately $216 per square foot. 4816 Millridge St is a home located in Johnson County with nearby schools including Riverview Elementary School, Mill Creek Middle School, and Mill Valley High School.
Ownership History
Date
Name
Owned For
Owner Type
Purchase Details
Closed on
Aug 20, 2012
Sold by
Inghram Leslie E
Bought by
Inghram Leslie E and Leslie E Inghram Living Trust
Current Estimated Value
Purchase Details
Closed on
Mar 23, 2007
Sold by
Inghram William Todd
Bought by
Inghram Leslie E
Purchase Details
Closed on
Aug 13, 2004
Sold by
Papa David M and Papa Betty J
Bought by
Inghram William T and Inghram Leslie E
Home Financials for this Owner
Home Financials are based on the most recent Mortgage that was taken out on this home.
Original Mortgage
$172,296
Interest Rate
6.02%
Mortgage Type
Purchase Money Mortgage
Purchase Details
Closed on
Jun 25, 2001
Sold by
Brown Patrick M and Brown Sylvia L
Bought by
Papa David M and Papa Betty J
Home Financials for this Owner
Home Financials are based on the most recent Mortgage that was taken out on this home.
Original Mortgage
$125,000
Interest Rate
7.16%
Create a Home Valuation Report for This Property
The Home Valuation Report is an in-depth analysis detailing your home's value as well as a comparison with similar homes in the area
Home Values in the Area
Average Home Value in this Area
Purchase History
| Date | Buyer | Sale Price | Title Company |
|---|---|---|---|
| Inghram Leslie E | -- | None Available | |
| Inghram Leslie E | -- | None Available | |
| Inghram William T | -- | Chicago Title Insurance Comp | |
| Papa David M | -- | Security Land Title Company |
Source: Public Records
Mortgage History
| Date | Status | Borrower | Loan Amount |
|---|---|---|---|
| Previous Owner | Inghram William T | $172,296 | |
| Previous Owner | Papa David M | $125,000 |
Source: Public Records
Tax History
| Year | Tax Paid | Tax Assessment Tax Assessment Total Assessment is a certain percentage of the fair market value that is determined by local assessors to be the total taxable value of land and additions on the property. | Land | Improvement |
|---|---|---|---|---|
| 2025 | $5,382 | $47,529 | $9,609 | $37,920 |
| 2024 | $5,382 | $46,322 | $8,732 | $37,590 |
| 2023 | $5,089 | $43,297 | $7,937 | $35,360 |
| 2022 | $4,806 | $40,055 | $7,213 | $32,842 |
| 2021 | $4,602 | $36,846 | $6,874 | $29,972 |
| 2020 | $4,121 | $32,683 | $5,728 | $26,955 |
| 2019 | $3,996 | $31,223 | $5,456 | $25,767 |
| 2018 | $3,782 | $29,279 | $5,456 | $23,823 |
| 2017 | $3,898 | $29,452 | $4,745 | $24,707 |
| 2016 | $3,773 | $28,152 | $4,316 | $23,836 |
| 2015 | $3,688 | $27,071 | $4,316 | $22,755 |
| 2013 | -- | $25,841 | $4,316 | $21,525 |
Source: Public Records
Map
Nearby Homes
- 21610 W 49th St
- 21436 W 48th St
- 4711 Roundtree Ct
- 4910 Marion St
- 21526 W 51st Terrace
- 5147 Payne St
- 4607 Aminda St
- 4531 Woodstock St
- 5314 Brockway St
- 9303 Aminda St
- 9313 Aminda St
- 9305 Aminda St
- 9307 Aminda St
- 5425 Payne Ct
- 21010 W 54th St
- 20907 W 53rd Terrace
- 5333 Hilltop Dr
- 5511 Chouteau St
- 4418 Silverheel St
- 4439 Meadow View Dr
- 4812 Millridge St
- 4820 Millridge St
- 4817 Noreston St
- 4821 Noreston St
- 4808 Millridge St
- 4824 Millridge St
- 4813 Noreston St
- 4825 Noreston St
- 4815 Millridge St
- 4804 Millridge St
- 4811 Millridge St
- 4823 Millridge St
- 4809 Noreston St
- 4807 Millridge St
- 21712 W 49th St
- 21716 W 49th St
- 4737 Millridge St
- 4818 Noreston St
- 4740 Millridge St
- 4805 Noreston St
Your Personal Tour Guide
Ask me questions while you tour the home.