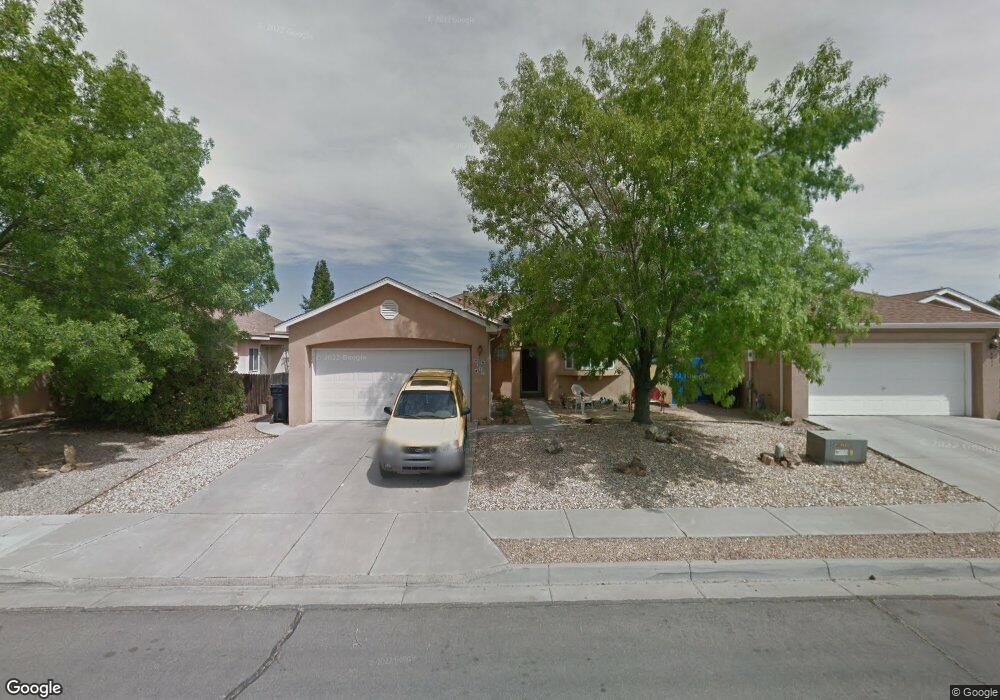
4817 Mesa Bonita Ct NW Albuquerque, NM 87120
Taylor Ranch NeighborhoodEstimated Value: $292,000 - $330,000
3
Beds
3
Baths
1,243
Sq Ft
$254/Sq Ft
Est. Value
About This Home
This home is located at 4817 Mesa Bonita Ct NW, Albuquerque, NM 87120 and is currently estimated at $315,414, approximately $253 per square foot. 4817 Mesa Bonita Ct NW is a home located in Bernalillo County with nearby schools including Chamiza Elementary School, L.B. Johnson Middle School, and Volcano Vista High School.
Ownership History
Date
Name
Owned For
Owner Type
Purchase Details
Closed on
May 30, 2024
Sold by
Gorsky Chelsea E
Bought by
Gorsky Robert S
Current Estimated Value
Purchase Details
Closed on
Aug 11, 2020
Sold by
Wilton Sherry A
Bought by
Gorsky Robert S and Gorsky Charles E
Home Financials for this Owner
Home Financials are based on the most recent Mortgage that was taken out on this home.
Original Mortgage
$178,236
Interest Rate
3%
Mortgage Type
FHA
Purchase Details
Closed on
Jul 28, 2011
Sold by
Wilton Sherry A
Bought by
Wilton Sherry A and Somers Kerrin E
Home Financials for this Owner
Home Financials are based on the most recent Mortgage that was taken out on this home.
Original Mortgage
$121,600
Interest Rate
4.53%
Mortgage Type
New Conventional
Purchase Details
Closed on
Oct 27, 1999
Sold by
Somervell Karen E
Bought by
Wilton Sherry A
Create a Home Valuation Report for This Property
The Home Valuation Report is an in-depth analysis detailing your home's value as well as a comparison with similar homes in the area
Home Values in the Area
Average Home Value in this Area
Purchase History
| Date | Buyer | Sale Price | Title Company |
|---|---|---|---|
| Gorsky Robert S | -- | None Listed On Document | |
| Gorsky Robert S | -- | Old Republic Natl Ttl Ins Co | |
| Wilton Sherry A | -- | Fidelity National Title Nm | |
| Wilton Sherry A | -- | -- |
Source: Public Records
Mortgage History
| Date | Status | Borrower | Loan Amount |
|---|---|---|---|
| Previous Owner | Gorsky Robert S | $178,236 | |
| Previous Owner | Wilton Sherry A | $121,600 |
Source: Public Records
Tax History Compared to Growth
Tax History
| Year | Tax Paid | Tax Assessment Tax Assessment Total Assessment is a certain percentage of the fair market value that is determined by local assessors to be the total taxable value of land and additions on the property. | Land | Improvement |
|---|---|---|---|---|
| 2025 | $2,913 | $71,124 | $12,379 | $58,745 |
| 2024 | $2,913 | $69,052 | $12,018 | $57,034 |
| 2023 | $2,865 | $67,041 | $11,668 | $55,373 |
| 2022 | $2,768 | $65,090 | $11,329 | $53,761 |
| 2021 | $2,676 | $63,194 | $10,999 | $52,195 |
| 2020 | $2,106 | $49,108 | $12,750 | $36,358 |
| 2019 | $2,045 | $47,678 | $12,379 | $35,299 |
| 2018 | $1,972 | $47,678 | $12,379 | $35,299 |
| 2017 | $1,911 | $46,289 | $12,018 | $34,271 |
| 2016 | $1,856 | $43,633 | $11,329 | $32,304 |
| 2015 | $42,363 | $42,363 | $10,999 | $31,364 |
| 2014 | $1,799 | $42,363 | $10,999 | $31,364 |
| 2013 | -- | $42,363 | $10,999 | $31,364 |
Source: Public Records
Map
Nearby Homes
- 6921 El Cajon Ct NW
- 4736 Galleta Rd NW
- 4612 Lobelia Rd NW
- 7432 Primrose Dr NW
- 7516 Wells Fargo Trail NW
- 5429 Gold Rush Dr NW
- 5136 Roanoke Ave NW
- 5404 Territorial Rd NW
- 4500 Samara Rd NW
- 7532 Deerfield Rd NW
- 7434 Riverton Dr NW
- 6212 Prairie Sage Dr NW
- 4409 Spanish Broom Ct NW
- 5305 Desert Sand Place NW
- 5333 Roanoke Ave NW
- 7557 Richmond Hill Rd NW
- 7708 Ridgeview Dr NW
- 7939 Independence Dr NW
- 4119 Sumac Dr NW
- 7809 Juneberry St NW
- 4811 Mesa Bonita Ct NW
- 4821 Mesa Bonita Ct NW
- 4809 Mesa Bonita Ct NW
- 4825 Mesa Bonita Ct NW
- 4816 Mesa Bonita Ct NW
- 4805 Mesa Bonita Ct NW
- 4820 Mesa Bonita Ct NW
- 4854 Los Serranos Ct NW
- 4844 Los Serranos Ct NW
- 4824 Mesa Bonita Ct NW
- 4858 Los Serranos Ct NW
- 4824 Los Serranos Ct NW
- 6900 Los Alisos Ct NW
- 4801 Mesa Bonita Ct NW
- 4808 Mesa Bonita Ct NW
- 4900 Mesa Bonita Ct NW
- 6904 Los Alisos Ct NW
- 4901 Mesa Bonita Ct NW
- 4800 Mesa Bonita Ct NW
- 4811 Mesa Prieta Ct NW