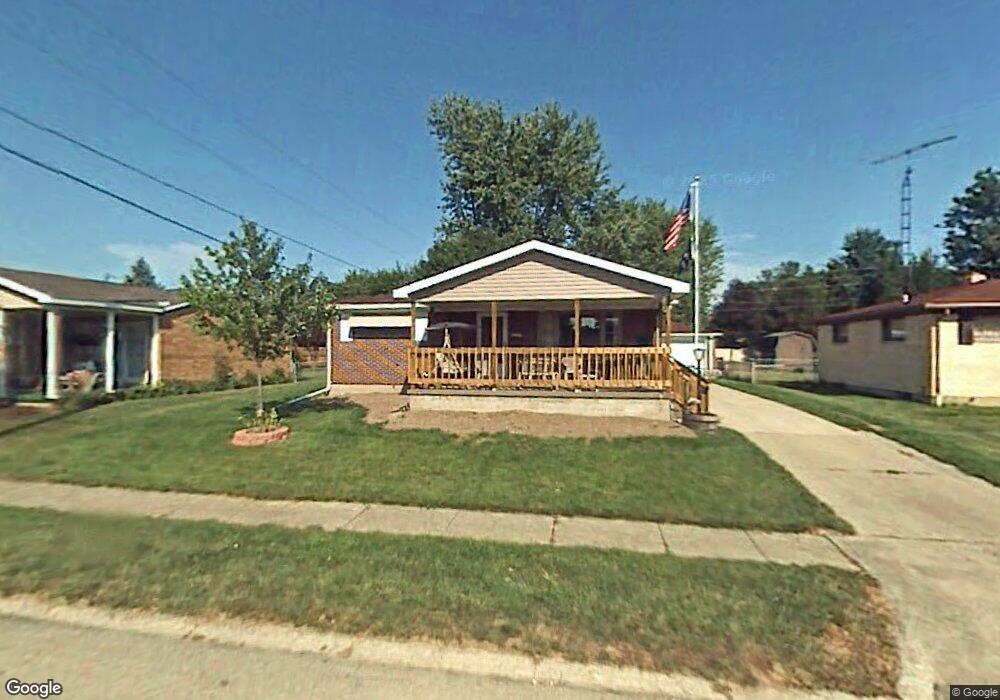
4818 Cullen Ave Springfield, OH 45503
Estimated Value: $167,000 - $194,000
2
Beds
1
Bath
875
Sq Ft
$207/Sq Ft
Est. Value
About This Home
This home is located at 4818 Cullen Ave, Springfield, OH 45503 and is currently estimated at $180,962, approximately $206 per square foot. 4818 Cullen Ave is a home located in Clark County with nearby schools including Northridge Elementary School, Kenton Ridge Middle & High School, and Emmanuel Christian Academy.
Ownership History
Date
Name
Owned For
Owner Type
Purchase Details
Closed on
Jun 10, 2011
Sold by
Brown Troy D
Bought by
Robinson Ashley R
Current Estimated Value
Home Financials for this Owner
Home Financials are based on the most recent Mortgage that was taken out on this home.
Original Mortgage
$72,020
Outstanding Balance
$49,392
Interest Rate
4.75%
Mortgage Type
New Conventional
Estimated Equity
$131,570
Purchase Details
Closed on
Apr 13, 2006
Sold by
Brown Troy D
Bought by
Zeman Christopher and Zeman Sheila
Home Financials for this Owner
Home Financials are based on the most recent Mortgage that was taken out on this home.
Original Mortgage
$82,800
Interest Rate
7%
Mortgage Type
Fannie Mae Freddie Mac
Purchase Details
Closed on
Aug 30, 1988
Bought by
Carey John F and Carey Lestie L
Purchase Details
Closed on
Mar 1, 1979
Create a Home Valuation Report for This Property
The Home Valuation Report is an in-depth analysis detailing your home's value as well as a comparison with similar homes in the area
Home Values in the Area
Average Home Value in this Area
Purchase History
| Date | Buyer | Sale Price | Title Company |
|---|---|---|---|
| Robinson Ashley R | $71,900 | Ohio Real Estate Title | |
| Zeman Christopher | $110,000 | None Available | |
| Brown Troy D | $113,500 | None Available | |
| Carey John F | $54,000 | -- | |
| -- | $40,500 | -- |
Source: Public Records
Mortgage History
| Date | Status | Borrower | Loan Amount |
|---|---|---|---|
| Open | Robinson Ashley R | $72,020 | |
| Previous Owner | Brown Troy D | $82,800 | |
| Previous Owner | Zeman Christopher | $108,000 |
Source: Public Records
Tax History
| Year | Tax Paid | Tax Assessment Tax Assessment Total Assessment is a certain percentage of the fair market value that is determined by local assessors to be the total taxable value of land and additions on the property. | Land | Improvement |
|---|---|---|---|---|
| 2025 | $2,019 | $59,890 | $17,190 | $42,700 |
| 2024 | $1,953 | $46,140 | $10,010 | $36,130 |
| 2023 | $1,953 | $46,140 | $10,010 | $36,130 |
| 2022 | $1,960 | $46,140 | $10,010 | $36,130 |
| 2021 | $1,780 | $35,490 | $7,410 | $28,080 |
| 2020 | $1,781 | $35,490 | $7,410 | $28,080 |
| 2019 | $1,815 | $35,490 | $7,410 | $28,080 |
| 2018 | $1,661 | $31,200 | $9,450 | $21,750 |
| 2017 | $1,424 | $30,416 | $9,447 | $20,969 |
| 2016 | $1,414 | $30,416 | $9,447 | $20,969 |
| 2015 | $1,429 | $30,055 | $9,086 | $20,969 |
| 2014 | $1,429 | $30,055 | $9,086 | $20,969 |
| 2013 | $1,396 | $30,055 | $9,086 | $20,969 |
Source: Public Records
Map
Nearby Homes
- 4802 Willowbrook Dr
- 4741 Cullen Ave
- 862 Brendle Trace Unit 20
- 5033 Ridgewood Rd E
- 4343 Burchill St
- 1521 Erika Dr
- 1341 Student Ave
- 1709 Thomas Dr
- 4446 Ridgewood Rd E Unit 3
- 4577 Reno Ln Unit 2
- 4652 Reno Ln Unit 15
- 593 Hiser Ave
- 4256 Midfield St Unit 9
- 5564 Ridgewood Rd W
- 1495 Victorian Way
- 5564 Ridgewood Rd E Unit 7
- 1707 Berwick Dr
- 1398 Elizabeth Ct Unit 66
- 1836 Dunseth Ln
- 937 Willow Rd
- 4824 Cullen Ave
- 4812 Cullen Ave
- 4830 Cullen Ave
- 4819 Willowbrook Dr
- 4806 Cullen Ave
- 4825 Willowbrook Dr
- 4813 Willowbrook Dr
- 4819 Cullen Ave
- 4831 Willowbrook Dr
- 4827 Cullen Ave
- 4813 Cullen Ave
- 4836 Cullen Ave
- 4800 Cullen Ave
- 4833 Cullen Ave
- 4807 Cullen Ave
- 4801 Willowbrook Dr
- 4837 Willowbrook Dr
- 4801 Cullen Ave
- 4839 Cullen Ave
- 4746 Cullen Ave
Your Personal Tour Guide
Ask me questions while you tour the home.